主管:中国科学院
主办:中国优选法统筹法与经济数学研究会
中国科学院科技战略咨询研究院
主办:中国优选法统筹法与经济数学研究会
中国科学院科技战略咨询研究院
中国管理科学 ›› 2024, Vol. 32 ›› Issue (4): 1-13.doi: 10.16381/j.cnki.issn1003-207x.2021.0382cstr: 32146.14.j.cnki.issn1003-207x.2021.0382
• • 下一篇
李仲飞1,周骐2( )
)
收稿日期:2021-02-26
修回日期:2021-04-20
出版日期:2024-04-25
发布日期:2024-04-25
通讯作者:
周骐
E-mail:zhouqi@scut.edu.cn
基金资助:
Zhongfei Li1,Qi Zhou2()
Received:2021-02-26
Revised:2021-04-20
Online:2024-04-25
Published:2024-04-25
Contact:
Qi Zhou
E-mail:zhouqi@scut.edu.cn
摘要:
行业配置是投资组合中承上启下的重要环节之一。传统的行业配置模型忽略了行业网络的整体关联性。本文以行业配置中广泛应用的Black-Litterman(BL)模型为基础(以机器学习和时间序列模型的预测值为主观观点),结合复杂网络方法,提出了BL模型的图示化表达方式,证明了BL模型最优投资组合权重与行业网络特征向量中心度之间的二次关系并进行了实证分析。在此基础上,提出了BL+Network行业配置模型,综合考虑行业间的整体关联风险,然后确定各行业投资比例。该过程从行业配置层面完善了复杂网络方法在“自上而下”投资组合管理中的应用框架。从与传统资产配置模型的实证比较发现,BL+Network模型的行业配置在夏普比率和增益损失比等指标上均有明显提高,在特征向量中心度处于序列中位数附近的行业配比较高,但配置行业数量并非越少越好。本研究为资产配置的研究提供了新视角,拓展了BL模型的交叉应用边界,补充了复杂网络方法在投资组合管理中的应用。
中图分类号:
李仲飞,周骐. 一个基于BL模型和复杂网络的行业配置模型[J]. 中国管理科学, 2024, 32(4): 1-13.
Zhongfei Li,Qi Zhou. An Industry Allocation Model Based on BL Model and Complex Network[J]. Chinese Journal of Management Science, 2024, 32(4): 1-13.
表1
BL模型中变量含义"
| 变量 | 含义 | 矩阵维度 | 变量 | 含义 | 矩阵维度 |
|---|---|---|---|---|---|
| 期望收益率向量 | 主观观点的信心误差矩阵 | ||||
| 调整系数 | 市场均衡收益率 | ||||
| 资产的市值权重 | 主观观点收益矩阵 | ||||
| 投资者主观观点矩阵 | 历史收益率的协方差矩阵 |
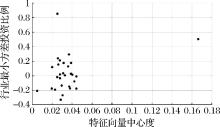
图1
基于最小方差模型的投资组合比例与特征向量中心度的关系"

表2
按中心度统计指标对行业进行分类"
| 中间中心度行业 | 中心度极值行业 | 中心度稳定的行业 | 中心度波动较大的行业 | 中间中心度稳定的行业 |
|---|---|---|---|---|
| 传媒,农林牧渔,汽车,食品饮料,通信,医药生物,综合 | 化工,银行,建筑,材料,有色金属,机械设备,非银金融 | 传媒,电气设备,食品饮料,交通运输,通信,医药生物,综合 | 房地产,纺织服装,非银金融,机械设备,建筑材料,银行,有色金属 | 传媒,食品饮料,通信,医药卫生,综合 |

图2
误差加权特征向量中心度正态性检验"
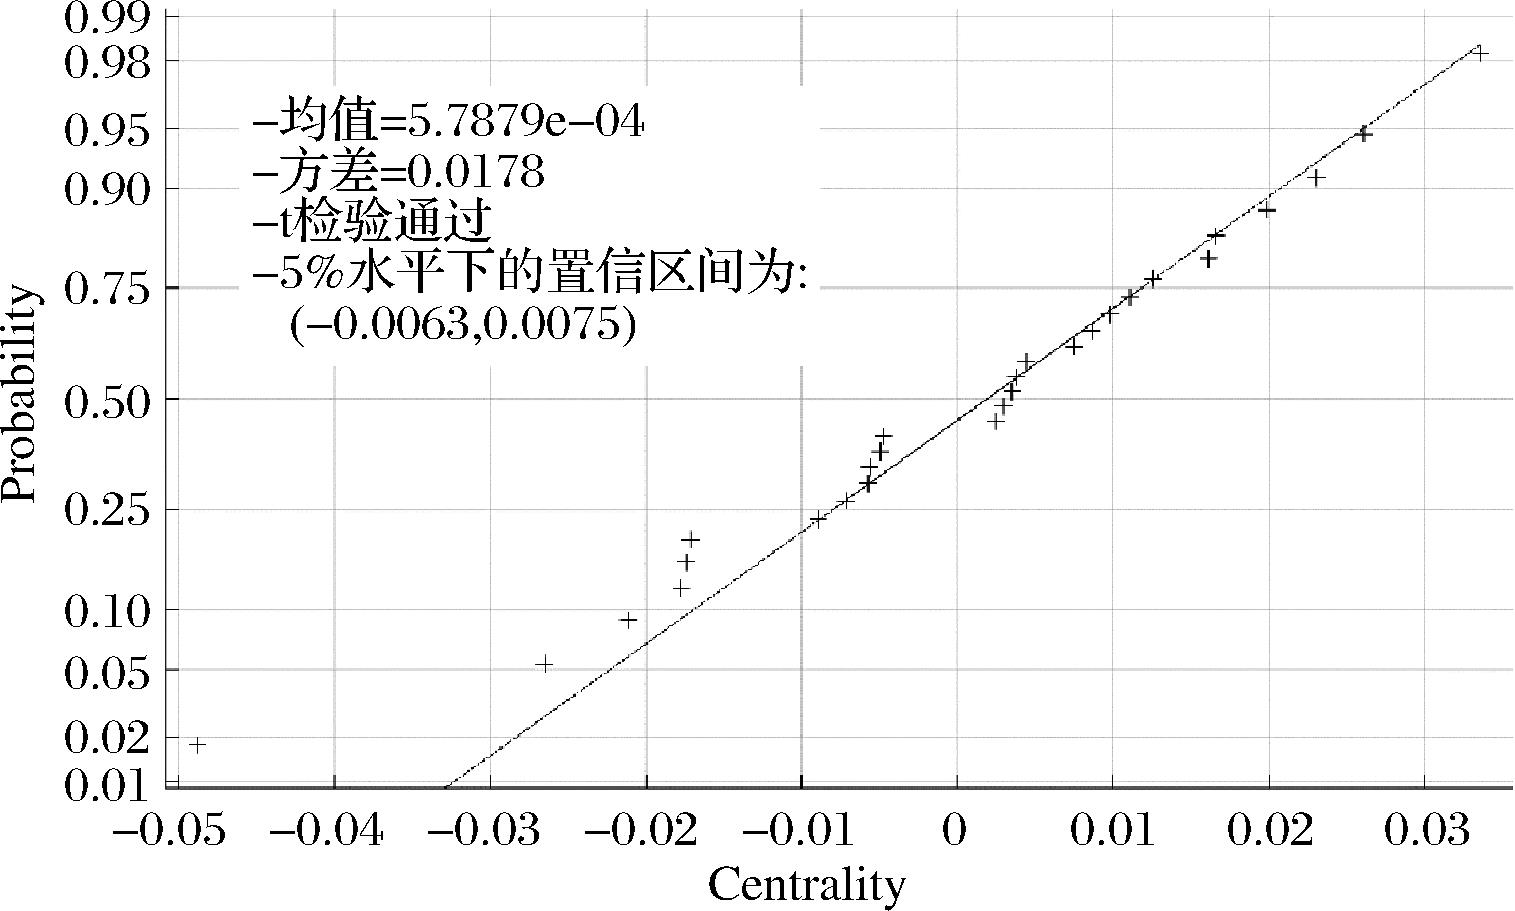

图3
中心度与BL模型最优投资比例(2017年4月)"
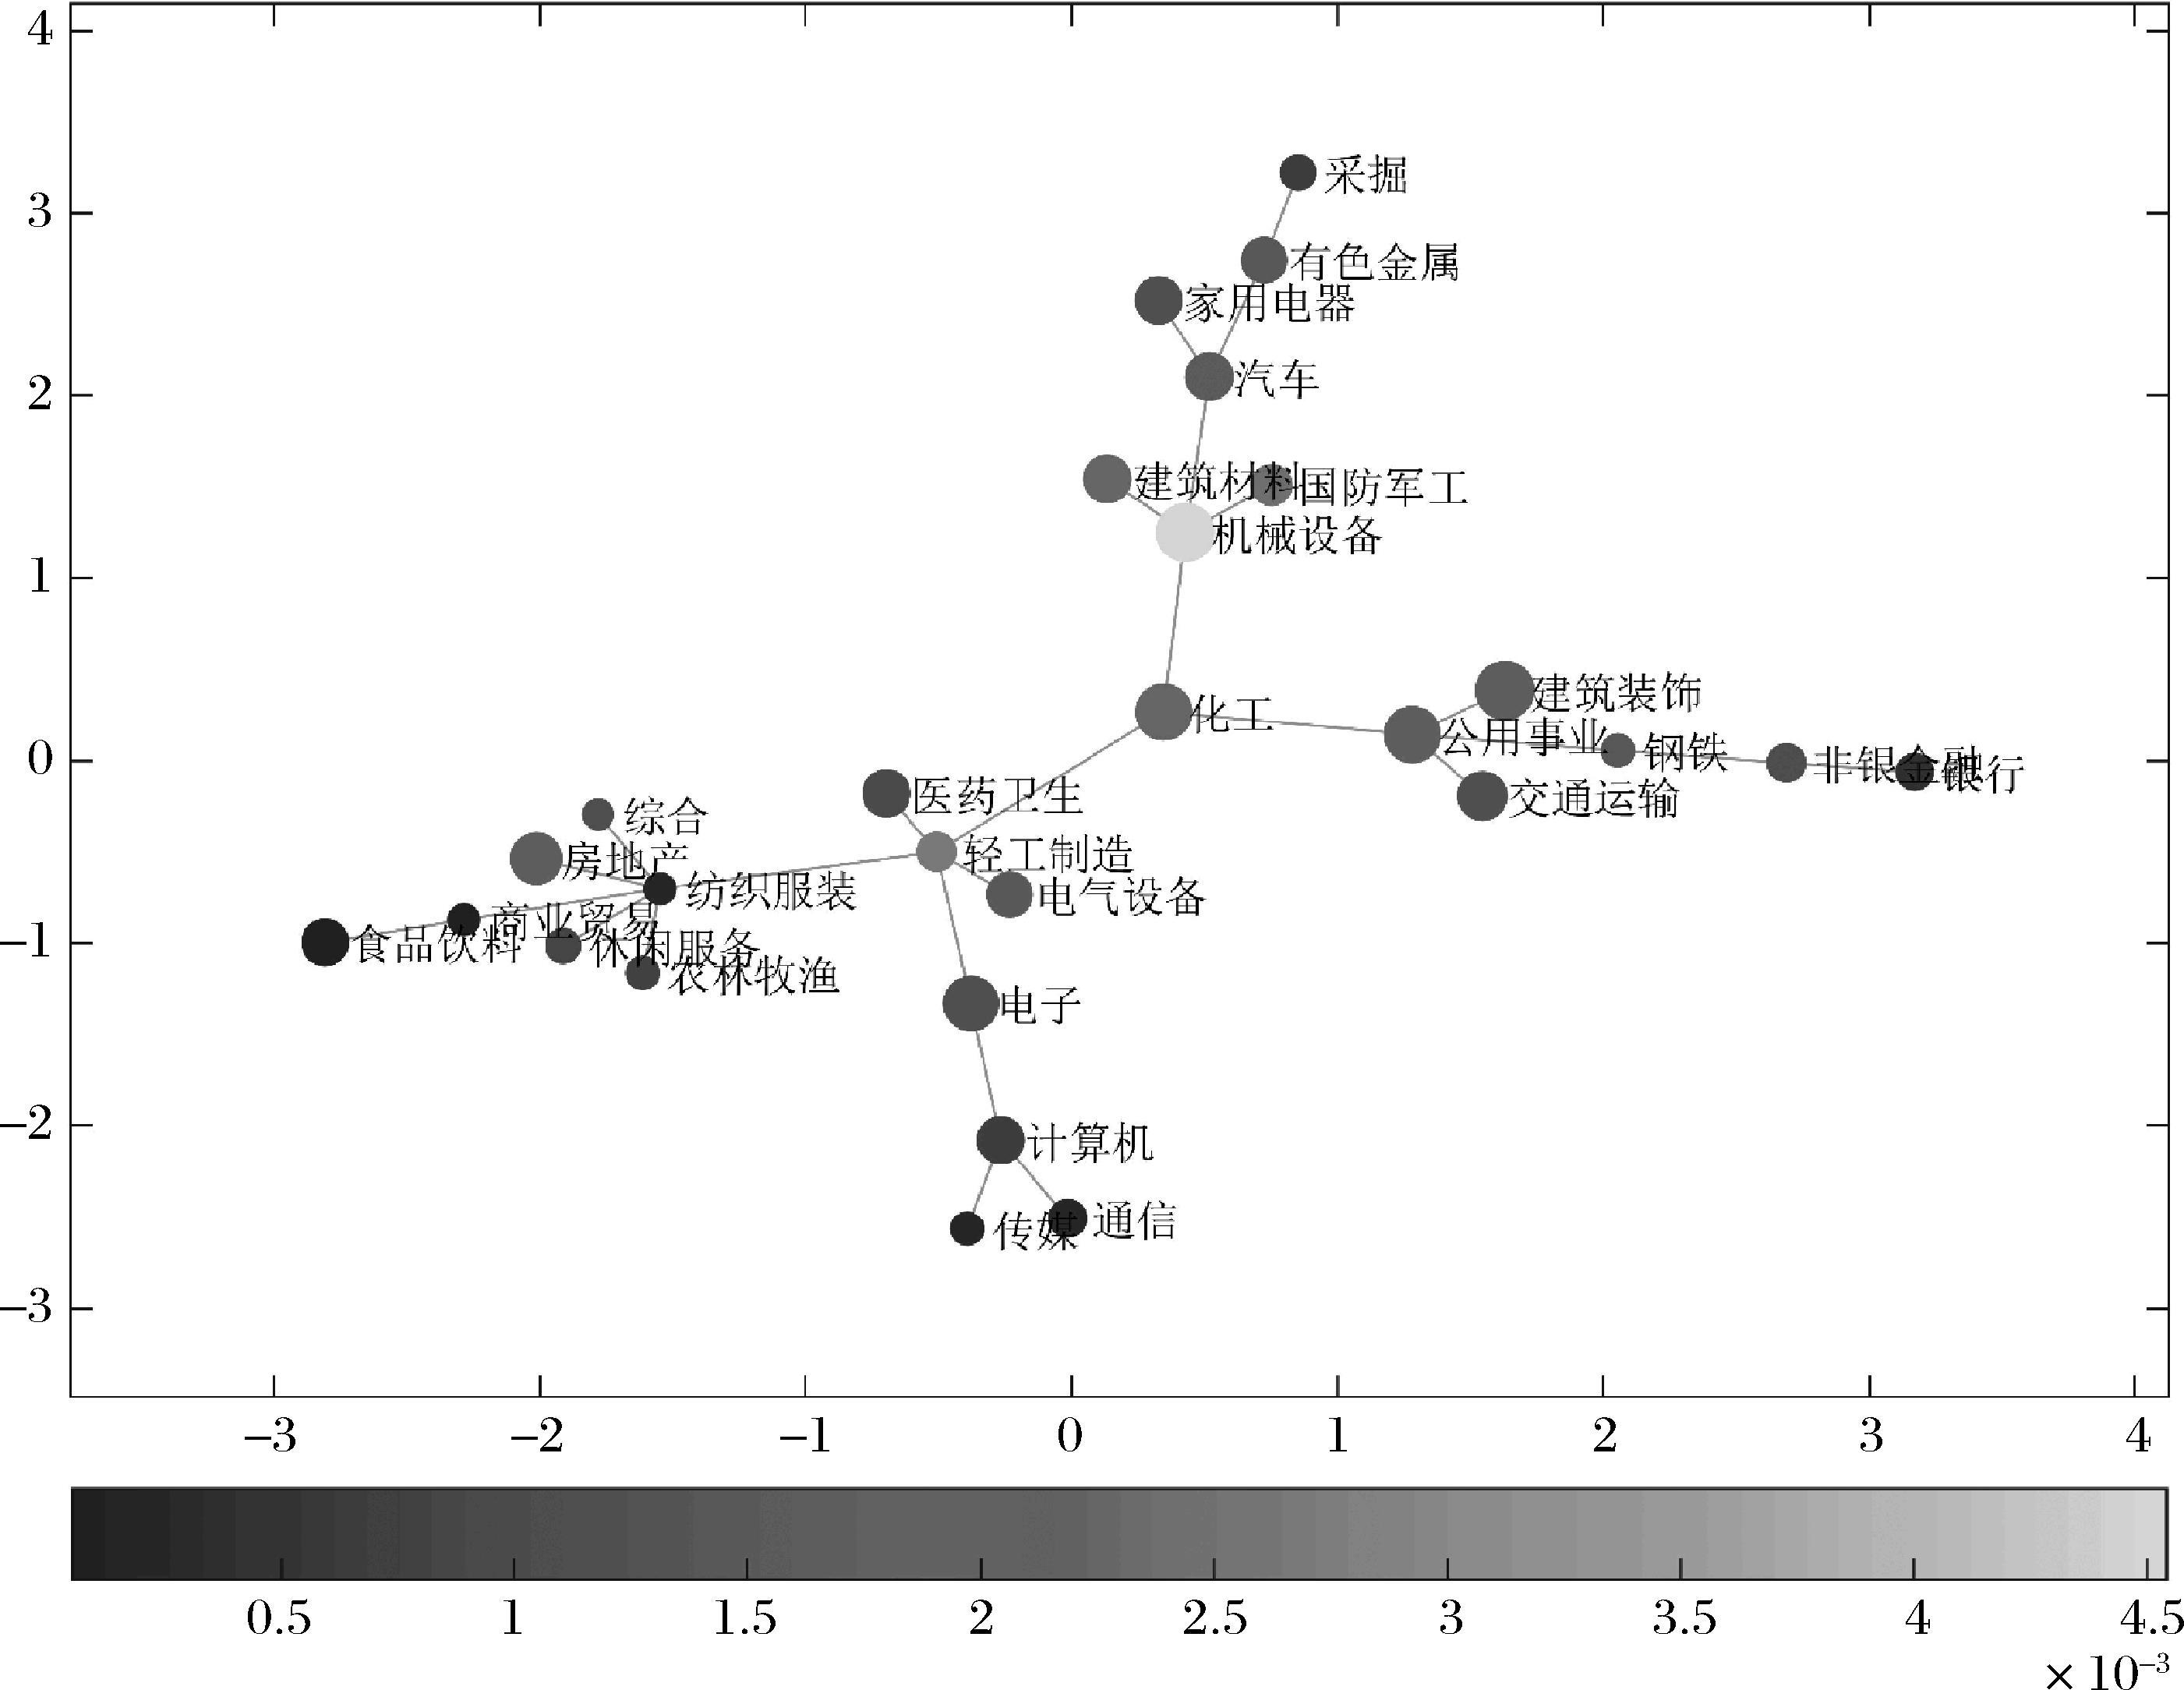
表3
BL模型最优投资比例的回归结果"
| 变量 | |||
|---|---|---|---|
-0.0152 (-2.41)** | -0.0143 (-3.85)*** | -0.0152 (-2.96)*** | |
0.4728 (3.29)*** | 0.3679 (4.25)*** | 0.3622 (3.47)*** | |
| N | 336 | 336 | 336 |
| 0.169 | 0.226 | 0.184 |
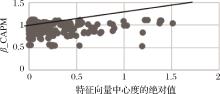
图4
中心度指标与CAPM模型中的β系数之间的关系"

表4
传统行业配置模型样本外收益率"
| 时间 | 1/N模型 | MV模型 | Min-V模型 | BL(GARCH)模型 | BL(MA)模型 | BL(SVM)模型 |
|---|---|---|---|---|---|---|
| 2017-04 | -0.0351 | -0.09004 | -0.05681 | -0.0316 | -0.02336 | -0.02674 |
| 2017-05 | -0.0469 | -0.0509 | 0.068128 | -0.0428 | -0.01639 | -0.04011 |
| 2017-06 | 0.0432 | 0.050526 | 0.217576 | 0.0490 | 0.039031 | 0.047659 |
| 2017-07 | 0.0113 | 0.155548 | 0.076737 | 0.0276 | 0.028705 | 0.031279 |
| 2017-08 | 0.029 | 0.004552 | -0.04298 | 0.0313 | 0.038751 | 0.03283 |
| 2017-09 | 0.0142 | -0.1745 | 0.012375 | 0.0176 | 0.015803 | 0.01811 |
| 2017-10 | 0.004 | 0.083156 | 0.074148 | 0.0134 | 0.009781 | 0.008235 |
| 2017-11 | -0.0355 | -0.47025 | 0.083917 | -0.0340 | -0.03495 | -0.03299 |
| 2017-12 | -0.005 | -0.03433 | -0.04684 | -0.0023 | 0.000196 | -0.00133 |
| 2018-01 | 0.0105 | 0.100866 | 0.150276 | 0.0144 | 0.012852 | 0.012724 |
| 2018-02 | -0.0431 | -0.04685 | -0.04539 | -0.0436 | -0.0155 | -0.04014 |
| 2018-03 | -0.0307 | 0.04185 | -0.46597 | 0.0165 | 0.020901 | 0.0161 |
| 平均收益率 | -0.0070 | -0.03586 | 0.002098 | 0.0013 | 0.0063 | 0.0021 |
| 夏普比率 | -0.2314 | -0.2187 | 0.0123 | 0.0408 | 0.2581 | 0.0704 |
| 方差 | 0.000917 | 0.026894 | 0.02905 | 0.000998 | 0.000599 | 0.00092 |
表5
2017年4月—2018年3月样本外BL+Network行业配置模型的表现"
| Strategy | Average Returns | Sharpe Ratio | Omega | Variance |
|---|---|---|---|---|
| Tradition | ||||
| 1/N | -0.00701 | -0.2314 | 0.5716 | 0.000917 |
| BL(GARCH) | 0.001289629 | 0.0408 | 0.5239 | 0.000997594 |
| BL(MA) | 0.006319 | 0.2581 | 1.8407 | 0.000599 |
| BL(SVM) | 0.0021342 | 0.0704 | 0.5415 | 0.000919635 |
| 1/N+Network | ||||
| 1/N- MidC | 0.001721157 | 0.0564 | 1.1388 | 0.000930666 |
| 1/N- LowC | -0.008525509 | -0.3277 | 0.4288 | 0.000676746 |
| 1/N- HighC | -0.003056117 | -0.098 | 0.7768 | 0.000972405 |
| 1/N-HSR | -0.004946272 | -0.1792 | 0.5874 | 0.000802374 |
| BL+Network | ||||
| BL(GARCH )-MidC | 0.00518347 | 0.15 | 0.5925 | 0.001193866 |
| BL(GARCH)- LowC | 0.004308787 | 0.0856 | 0.551 | 0.002531251 |
| BL(GARCH) -HighC | -0.004333741 | -0.0723 | 0.4557 | 0.003595042 |
| BL(GARCH)-HSR | 0.001305736 | 0.03056 | 0.4938 | 0.003078329 |
| BL(MA)-MidC | 0.024765016 | 0.5466 | 4.2366 | 0.002052442 |
| BL(MA)-LowC | 0.013375332 | 0.3654 | 0.7218 | 0.001340048 |
| BL(MA)-HighC | 0.004961713 | 0.0978 | 0.5625 | 0.002572639 |
| BL(MA)-HSR | 0.00812953 | 0.1972 | 0.6146 | 0.001973671 |
| BL(SVM) -MidC | 0.004373806 | 0.1311 | 0.5818 | 0.001113676 |
| BL(SVM)-LowC | 0.004095918 | 0.0871 | 0.5535 | 0.002212517 |
| BL(SVM)-HighC | 6.70765E-05 | 0.001 | 0.5007 | 0.004228955 |
| BL(SVM)-HSR | 0.001539855 | 0.0274 | 0.0516 | 0.002965301 |
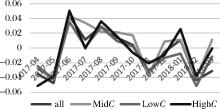
图5
1/N网络投资模型月收益率(不同中心度)"


图6
BL(SVM)网络投资模型月收益率(不同中心度)"
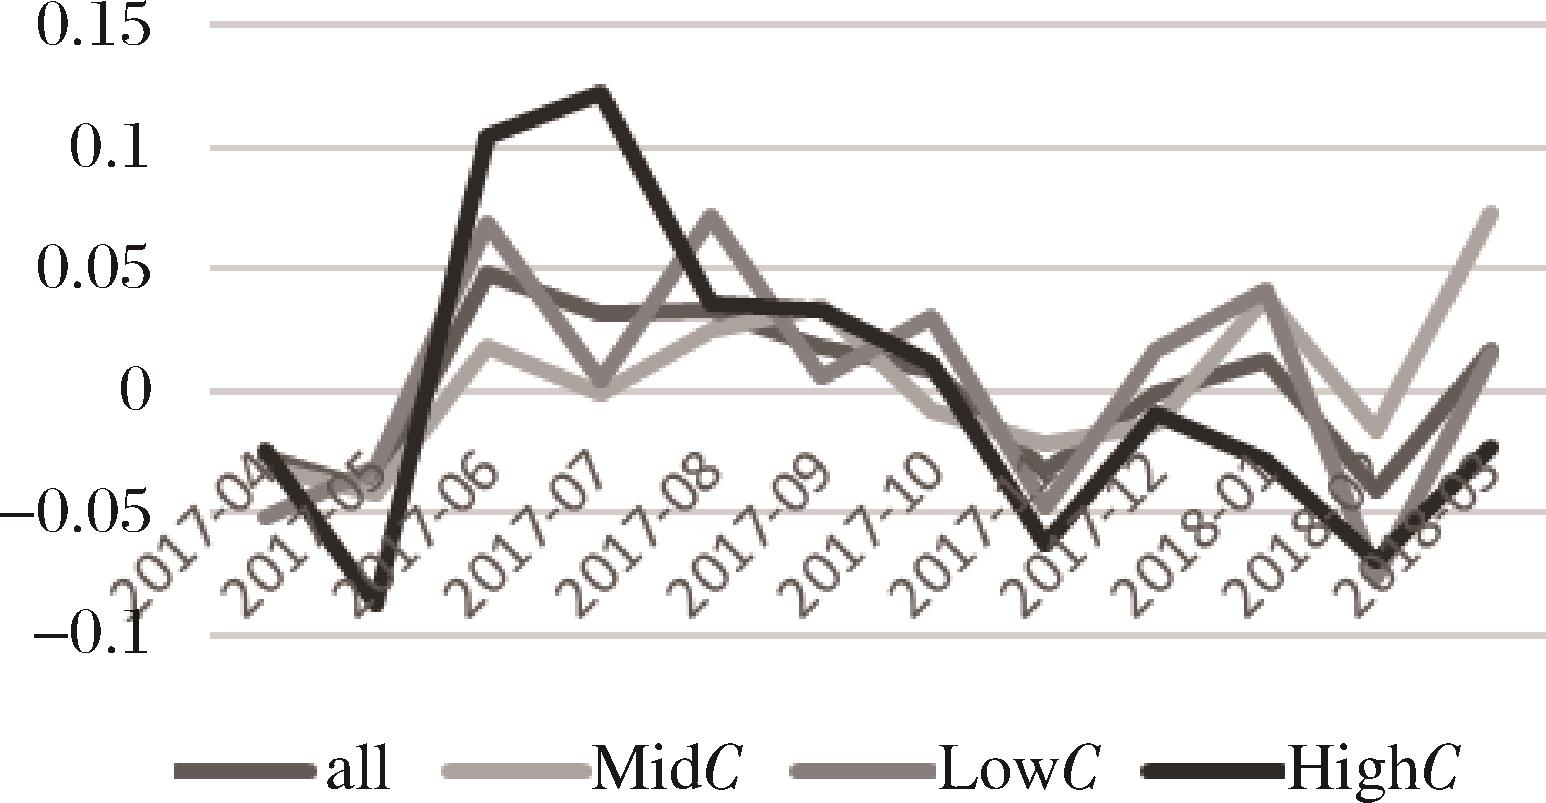

图7
BL(MA)网络投资模型月收益率(不同中心度)"
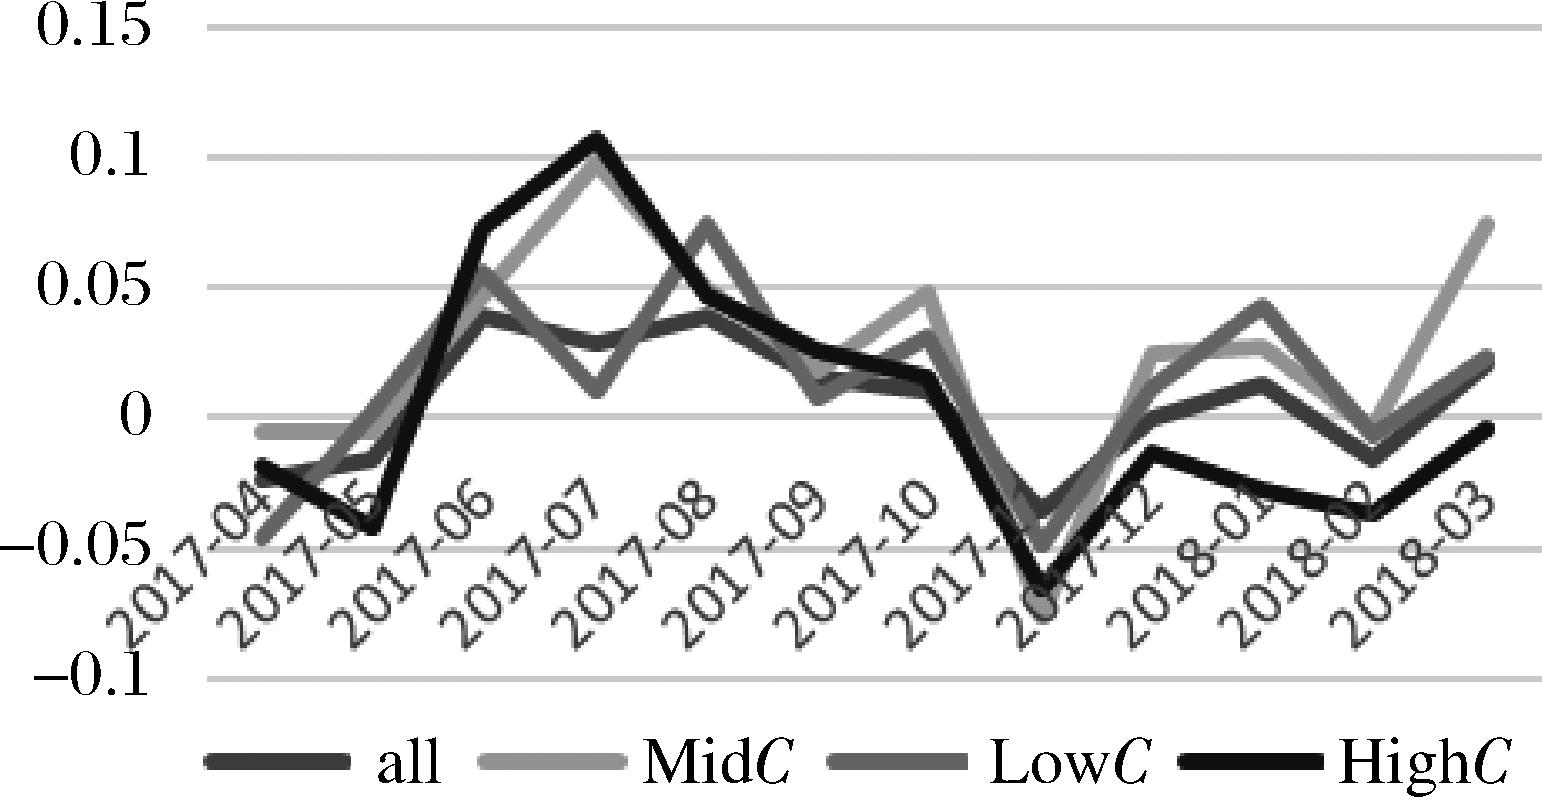

图8
BL(GARCH)网络投资模型月收益率(不同中心度)"
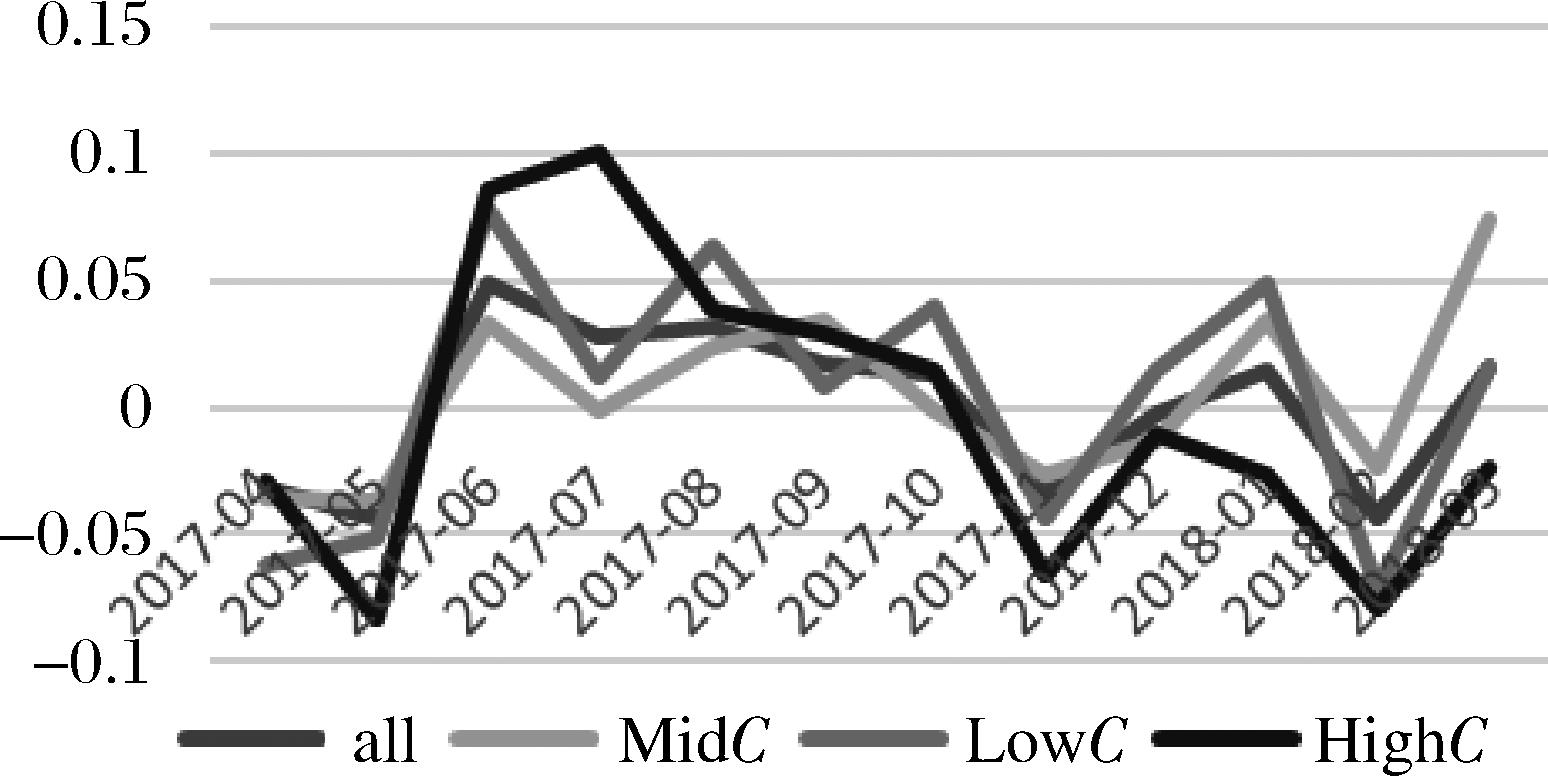
表6
2017年4月—2018年3月样本外网络行业配置模型表现(缩小中间中心度行业个数)"
| Strategy | Average Returns | Sharpe Ratio | Omega | Variance |
|---|---|---|---|---|
| Strategy of 1/N in Network | ||||
| 1/N-MidC-9 | 0.001721 | 0.0564 | 1.13884 | 0.000930666 |
| 1/N-MidC-7 | 0.005087 | 0.148 | 1.417339 | 0.001180472 |
| 1/N-MidC-5 | 0.00835 | 0.2065 | 1.656672 | 0.00163459 |
| Strategy of BL in Network | ||||
| BL(MA)-MidC-9 | 0.024765 | 0.5466 | 4.236592 | 0.002052442 |
| BL(MA)-MidC-7 | 0.027959 | 0.64 | 6.103315 | 0.001908212 |
| BL(MA)-MidC-5 | 0.020599 | 0.5177 | 4.726464 | 0.001584634 |
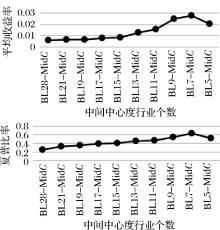
图9
2017年4月—2018年3月随着中间中心度行业个数的变化平均收益率和夏普比率的变化趋势"

| 1 | Li D, Ng W L. Optimal dynamic portfolio selection: multi-period mean‐variance formulation[J]. Mathematical Finance, 2000, 10(3): 387–406. |
| 2 | Zhou X Y, Li D. Continuous-time mean-variance portfolio selection: a stochastic LQ framework[J]. Applied Mathematics & Optimization, 2000, 42(1): 19-33. |
| 3 | Yao H, Li Z, Li D. Multi-period mean-variance portfolio selection with stochastic interest rate and uncontrollable liability[J]. European Journal of Operational Research, 2016, 252(3): 837-851. |
| 4 |
黄金波, 吴莉莉, 尤亦玲. 非对称Laplace分布下的均值-VaR模型[J].中国管理科学, 2020, DOI:10.16381/j.cnki.issn1003-207x.2019.1681 .
doi: 10.16381/j.cnki.issn1003-207x.2019.1681 |
|
Huang J B, Wu L L, You Y L. Mean-VaR model based on the asymmetric Laplace distribution[J]. Chinese Journal of Management Science, 2020, DOI:10.16381/j.cnki.issn1003-207x.2019.1681 .
doi: 10.16381/j.cnki.issn1003-207x.2019.1681 |
|
| 5 | Merton R C. On estimating the expected return on the market: an exploratory investigation[J]. Journal of Financial Economics, 1980, 8(4): 323-361. |
| 6 | De Miguel V, Garlappi L, Uppal R. Optimal versus naive diversification: how inefficient is the 1/N portfolio strategy?[J]. Review of Financial Studies, 2009, 22(5): 1915-1953. |
| 7 | Mandere E O. Financial networks and their applications to the stock market[D]. Bowling Green State University, 2009. |
| 8 | Peralta G, Zareei A. A network approach to portfolio selection[J]. Journal of Empirical Finance, 2016, 38: 157-180. |
| 9 | 黄乃静, 张冰洁, 郭冬梅, 等. 中国股票市场行业间金融传染检验和风险防范[J]. 管理科学学报, 2017(12): 19-28. |
| Huang N J, Zhang B J, Guo D M, et al. Industry-level financial contagion of the Chinese stock market and risk control[J]. Journal of Management Science in China, 2017(12): 19-28. | |
| 10 | 肖琴. 复杂网络在股票市场相关分析中的应用[J]. 中国管理科学, 2016, 24(S1): 470-474. |
| Xiao Q. Application of the complex network in stock market board analysis[J]. Chinese Journal of Management Science, 2016, 24(S1): 470-474. | |
| 11 | 李政, 梁琪, 涂晓枫.我国上市金融机构关联性研究——基于网络分析法[J]. 金融研究, 2016(8): 95-110. |
| Li Z, Liang Q, Tu X F. The connectedness of chinese listed financial institutions:a study based on network analysis[J]. Journal of Financial Research, 2016(8): 95-110. | |
| 12 | 胡振华, 覃子龙, 杨燕. 基于互信息的深证股票复杂网络拓扑性质分析[J]. 统计与决策, 2016(20): 160-163. |
| Hu Z H, Qin Z L, Yang Y. Topological property analysis of Shenzhen stock with complex network based on mutual information[J]. Statistics & Decision, 2016(20): 160-163. | |
| 13 | 鲍勤, 孙艳霞. 网络视角下的金融结构与金融风险传染[J]. 系统工程理论与实践, 2014, 34(9): 2202-2211. |
| Bao Q, Sun Y X. Financial structure and financial contagion from the network perspective[J]. System Engineering Theory and Practice, 2014, 34(9): 2202-2211. | |
| 14 | 杨海军, 胡敏文. 基于核心-边缘网络的中国银行风险传染[J]. 管理科学学报, 2017(10): 49-61. |
| Yang H J, Hu M W. Risk contagion of Chinese interbank markets based on core-periphery network[J]. Journal of Management Science in China, 2017(10): 49-61. | |
| 15 | 张来军, 杨治辉, 路飞飞. 基于复杂网络理论的股票指标关联性实证分析[J]. 中国管理科学, 2014, 22(12): 85-92. |
| Zhang L J, Yang Z H, Lu F F. Empirical analysis of relevance of stock indicators based on complex network theory[J]. Chinese Journal of Management Science, 2014, 22(12): 85-92. | |
| 16 | 隋聪, 王宗尧. 银行间网络的无标度特征[J]. 管理科学学报, 2015, 18(12): 18-26. |
| Sui C, Wang Z Y. Interbank network scale-free characteristics[J]. Journal of Management Science in China, 2015, 18(12): 18-26. | |
| 17 | 钟韬, 彭勤科. 基于社会网络分析的投资组合优选方法[J]. 系统工程理论与实践, 2015, 35(12): 3017-3024. |
| Zhong T, Peng Q K. Portfolio selection method based on social network analysis[J]. System Engineering-Theory & Practice, 2015, 35(12): 3017-3024. | |
| 18 | 庄新田, 黄小原. 金融网络下投资组合风险及最优规模研究[J]. 管理科学学报, 2004(3): 54-58. |
| Zhuang X T, Huang X Y. Research on investment portfolio risk and optimization scale under financial networks[J]. Journal of Management Science in China, 2004(3): 54-58. | |
| 19 | Diebold F X, Yilmaz K. On the network topology of variance decompositions: measuring the connectedness of financial firms [J]. Journal of Econometrics, 2011, 182(1): 119-134. |
| 20 | Barigozzi M, Brownlees C. Nets: network estimation for time series[J]. Journal of Applied Econometrics, 2019, 34(3): 347-364. |
| 21 | Peralta G. Network-Based measures as leading indicators of market instability: the case of the spanish stock market[J]. Social Science Electronic Publishing, 2015. |
| 22 | Billio M, Getmansky M, Lo A W, et al. Econometric measures of connectedness and systemic risk in the finance and insurance sectors[J]. Journal of Financial Economics, 2012, 104(3): 535-559. |
| 23 | Dees B S, Stanković L, Constantinides A G, et al. Portfolio cuts: a graph-theoretic framework to diversification[C]//ICASSP 2020-2020 IEEE International Conference on Acoustics, Speech and Signal Processing (ICASSP). IEEE, 2020: 8454-8458. |
| 24 | Cerqueti R, Lupi C. Risk Measures on networks and expected utility[J]. Reliability Engineering & System Safety, 2016, 155: 1-8. |
| 25 | Huang S, Chow N S C, Xu R, et al. Analyzing the Hong Kong stock market structure: a complex network approach[R]. Working Paper, SSRN 2633433, 2015. |
| 26 | Li H, An H, Fang W, et al. Global energy investment structure from the energy stock market perspective based on a Heterogeneous Complex Network Model[J]. Applied Energy, 2017, 194: 648-657. |
| 27 | Pozzi F, Di M T, Aste T. Spread of risk across financial markets: better to invest in the peripheries [J]. Scientific Reports, 2013, 3(3): 1665. |
| 28 | Puerto J, Rodríguez-Madrena M, Scozzari A. Clustering and portfolio selection problems: a unified framework[J]. Computers & Operations Research, 2020, 117: 104891. |
| 29 | Alvin C M L, Ashish A, Prabhudev K, et al. Network analysis of search dynamics: the case of stock habitats[J]. Management Science, 2017, 63(8): 2667-2687. |
| 30 | Zareei A. Network origins of portfolio risk[J]. Journal of Banking & Finance, 2019, 109: 105663. |
| 31 | 张维, 武自强, 张永杰, 等. 基于复杂金融系统视角的计算实验金融: 进展与展望[J]. 管理科学学报, 2013, 16(6): 85-94. |
| Zhang W, Wu Z Q, Zhang Y J, et al. Agent-based computational finance on complex financial system perspective: progress and prospects[J]. Journal of Management Science in China, 2013, 16(6): 85-94. | |
| 32 | Glasserman P, Young H P. How likely is contagion in financial networks?[J]. Journal of Banking & Finance, 2015, 50: 383-399. |
| 33 | Newman M E J. The mathematics of networks[J]. The New Palgrave Encyclopedia of Economics, 2008, 2(2008): 1-12. |
| 34 | Black F, Litterman R. Global portfolio optimization[J]. Financial Analysts Journal, 1992: 28-43. |
| 35 | Fama E F, Macbeth J D. Risk, return, and equilibrium: some empirical tests[J]. Journal of Political Economy, 1973, 81(3): 607-636. |
| 36 | Mantegna R N. Hierarchical structure in financial markets[J]. The European Physical Journal B, 1999, 11(1): 193-196. |
| 37 | 尹群耀, 何建敏, 卞曰瑭. 基于STSA的中国股市的聚集效应研究——以上证50指数为例[J]. 系统工程, 2013(1): 10-17. |
| Yin Q Y, He J M, Bian R T. Aggregation effect of the china stock market based on STSA method:take SSE 50 Index as an example[J]. Systems Engineering, 2013(1): 10-17. | |
| 38 | 欧阳红兵, 刘晓东. 中国金融机构的系统重要性及系统性风险传染机制分析——基于复杂网络的视角[J]. 中国管理科学, 2015, 23(10): 30-37. |
| Ouyang H B, Liu X D. An analysis of the systemic importance and systemic risk contagion mechanism of China’s financial institutions based on network analysis[J]. Chinese Journal of Management Science, 2015, 23(10): 30-37. | |
| 39 | Keating C, Shadwick W F. A universal performance measure[J]. Journal of Performance Measurement, 2002, 6(3): 59-84. |
| 40 | Idzorek T. A step-by-step guide to the black-litterman model: incorporating user-specified confidence levels[J]. Forecasting Expected Returns in the Financial Markets, 2007: 17-38. |
| 41 | Jones C M, Lamont O A. Short-sale constraints and stock returns[J]. Journal of Financial Economics, 2002, 66(2-3): 207-239. |
| [1] | 何汉,李思呈. 基于有向复杂网络的担保圈违约风险传染建模研究[J]. 中国管理科学, 2024, 32(6): 22-33. |
| [2] | 盛积良,黄毅,李居超. 我国行业风险敞口与行业网络结构的相关性研究[J]. 中国管理科学, 2024, 32(2): 199-209. |
| [3] | 王磊, 李守伟, 何建敏, 候德飞. 网络舆情扰动下房地产投资者“追涨杀跌”行为扩散研究[J]. 中国管理科学, 2023, 31(1): 56-69. |
| [4] | 王伟明, 徐海燕, 朱建军. 基于复杂网络和语言信息的交互式大规模群体评价方法[J]. 中国管理科学, 2022, 30(11): 260-271. |
| [5] | 刘超, 郭亚东. 多时间尺度下行业间系统性金融风险溢出及拓扑结构分析[J]. 中国管理科学, 2022, 30(10): 46-59. |
| [6] | 莫东序, 郑田丹. 基于复杂网络的投资组合优化研究[J]. 中国管理科学, 2021, 29(5): 25-33. |
| [7] | 谢赤, 胡雪晶, 王纲金. 金融危机10年来中国股市动态演化与市场稳健研究——一个基于复杂网络视角的实证[J]. 中国管理科学, 2020, 28(6): 1-12. |
| [8] | 张奇, 李彦, 王歌, 朱丽晶, 胡滢, 王乐. 基于复杂网络的电动汽车充电桩众筹市场信用风险建模与分析[J]. 中国管理科学, 2019, 27(8): 66-74. |
| [9] | 杨湘浩, 段哲哲, 王筱莉. 考虑遗忘机制的企业隐性知识传播SIR模型研究[J]. 中国管理科学, 2019, 27(7): 195-202. |
| [10] | 邹星琪, 杨青. 基于项目网络支配和扩散关系的研发项目组合选择[J]. 中国管理科学, 2019, 27(4): 198-209. |
| [11] | 庞晓波, 王克达. 国际金融危机潜在传染源的识别及其传染力分析[J]. 中国管理科学, 2018, 26(3): 43-50. |
| [12] | 卞曰瑭, 李金生, 许露. 网络协调博弈策略下的股市羊群行为演化模型及仿真[J]. 中国管理科学, 2017, 25(3): 20-29. |
| [13] | 张锴琦, 杜海峰, 王晶晶. 集群行为中的复杂网络结构合并优化方法[J]. 中国管理科学, 2017, 25(12): 59-67. |
| [14] | 韩松, 苏熊. 中国商业银行结构效率研究: 基于复杂网络DEA模型[J]. 中国管理科学, 2016, 24(8): 1-9. |
| [15] | 欧阳红兵, 刘晓东. 中国金融机构的系统重要性及系统性风险传染机制分析——基于复杂网络的视角[J]. 中国管理科学, 2015, 23(10): 30-37. |
| 阅读次数 | ||||||||||||||||||||||||||||||||||||||||||||||||||
|
全文 633
|
|
|||||||||||||||||||||||||||||||||||||||||||||||||
|
摘要 328
|
|
|||||||||||||||||||||||||||||||||||||||||||||||||
|
||