 PDF(14454 KB)

2021年10月2 -6日山西持续性极端降水过程低空急流及水汽输送特征分析
孙颖姝, 周玉淑, 邓国, 苗青, 邱贵强
PDF(14454 KB)
2021年10月2 -6日山西持续性极端降水过程低空急流及水汽输送特征分析
The Analysis of Low-Level Jet and Water Vapor Transportation Characteristics on Continuous Extreme Precipitation in Shanxi from 2 to 6 October 2021
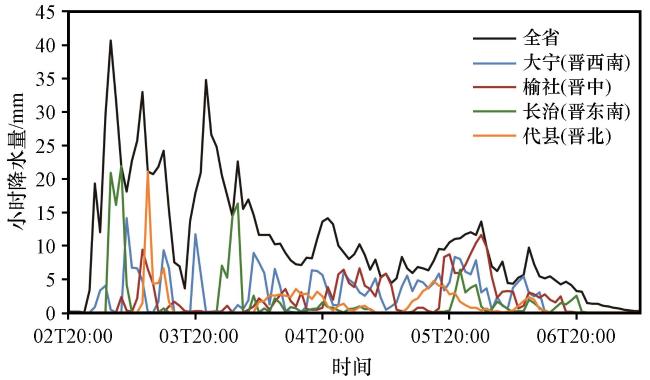
2021年10月2 -6日, 山西发生有气象记录以来秋季最强的持续性降水。本文利用自动气象站降水观测资料、 ERA5再分析资料、 NCEP GDAS再分析资料对此次极端降水过程的环流形势、 低空急流及水汽输送特征、 水汽源地等进行了分析, 结果表明此次极端降水过程有明显的阶段性特点。第一阶段(2 -3日)为锋前暖区降水, 集中发生在山西南部, 雨强大且波动性强, 对流性降水特征显著; 第二阶段(4 -6日)为锋后稳定性降水, 雨强小但持续时间长, 导致山西中南部出现持续性暴雨。环流分析显示, 异常偏北、 偏强的西太平洋副热带高压和异常偏南、 偏强的西西伯利亚切断低涡共同构建有利的环流背景。整个降水期间, 异常偏北、 偏强的700 hPa低空急流稳定维持, 对低层辐合场的加强、 垂直上升运动的强烈发展及水汽持续供应有重要作用, 是导致降水极端性形成的关键。850 hPa低空急流存在时间短, 但在第一阶段对晋东南暖湿空气输送和不稳定层结构建至关重要。强降水区水汽输入的主要层次在降水期间逐渐升高, 第一阶段集中在850 hPa附近, 第二阶段集中在700 hPa附近, 对应天气形势演变。此次极端降水过程的水汽源地主要为南海、 东海和黄海, 输送路径为东南路径, 明显区别于其他暴雨过程, 其他暴雨的水汽源地多为孟加拉湾、 阿拉伯海和南海, 以西南路径输送为主。
From 2 to 6 October 2021, Shanxi experienced the most intense continuous precipitation in autumn in meteorological records.Based on the precipitation observation data of automatic meteorological stations, ERA5 reanalysis data and NCEP GDAS reanalysis data, this study analyzed the circulation situation, low-level jet and water vapor transportation characteristics and water vapor sources of the extreme precipitation.The results indicated that the continuous extreme precipitation process had obvious phased characteristics.In the first stage (from 2nd to 3rd October), the precipitation occurred in the warm area in front of the cold front and mainly in southern Shanxi.There were obvious convective precipitation characteristics which showed high and strongly fluctuant precipitation intensity.The precipitation of the second stage (from 4th to 6th October) was stable one behind the front which showed low precipitation intensity and long duration, resulting in continuous rainstorm in central and southern Shanxi.The circulation analysis revealed that the abnormally north-located and strong Western Pacific subtropical high and the abnormally south-located and strong West Siberian cut-off vortex constituted a favorable circulation background.During the whole precipitation process, compared with other rainstorm process, the abnormally north-located and strong low-level jet at 700 hPa remained stable which played an important role in the strengthening of low-level convergence, the intense development of vertical upward movement and the continuous water vapor supply.And it was the key to the formation of extreme precipitation.The low-level jet at 850 hPa existed a shorter time but played an important role in the transportation of warm wet air and the construction of unstable layer in southeast Shanxi in the first stage.The main water vapor input level of the heavy rainfall area increased gradually during the precipitation, with the first stage mainly around 850 hPa and the second stage mainly around 700 hPa, which was corresponding to the evolution of the weather situation.The sources of the water vapor in this extreme precipitation were mainly from the South China Sea, the East China Sea and the Yellow Sea, and the transportation path was southeast path, obviously different from other heavy rainfalls which main water vapor sources were mostly from the Bay of Bengal, the Arabian Sea and the South China Sea and the transportation path was southwest path.
极端降水 / 低空急流 / 水汽输送 / HYSPLIT后向追踪 {{custom_keyword}} /
extreme precipitation / low-level jet / water vapor transportation / backward tracing by HYSPLIT {{custom_keyword}} /
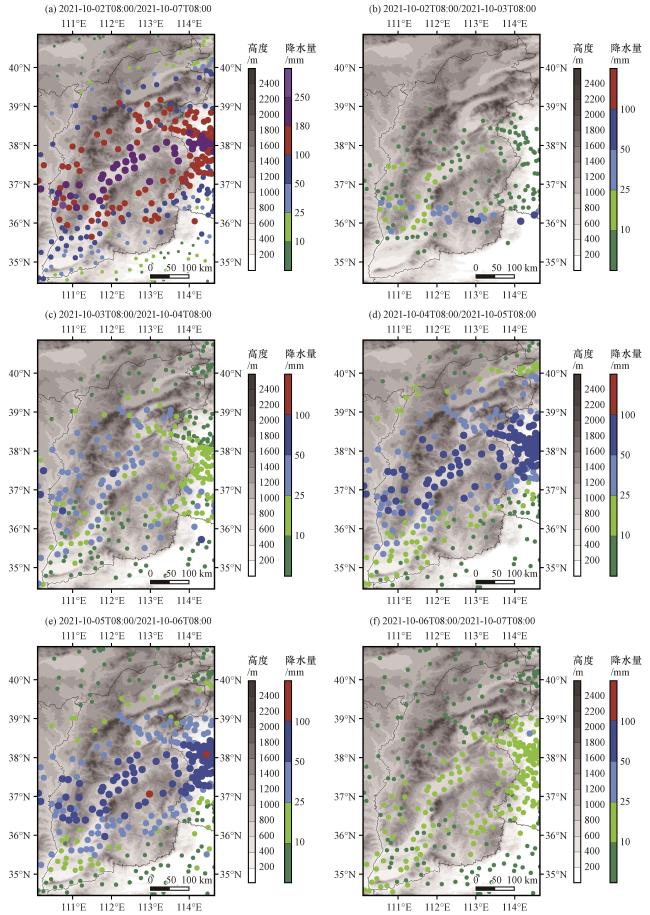
图1 2021年10月2 -6日总降水量(a)及逐日累计降水量(b~f)(彩色圆点, 单位: mm)灰色阴影为地形高度(单位: m) Fig.1 Total precipitation and daily accumulated precipitation from October 2 to 6, 2021 (color dotted, unit: mm).Grey shadings represent the height of terrain (unit: m) |
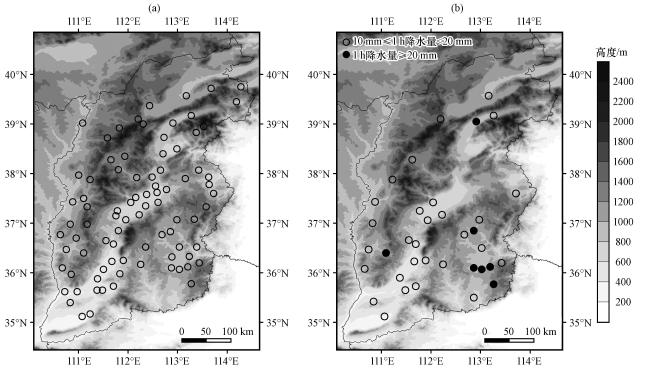
图2 2021年10月2 -6日总降水量超过历史同期极值的站点(a)及2 -6日出现1 h降水量达10 mm以上且超过历史同期极值的站点(b)Fig.2 Stations where total precipitation from October 2 to 6, 2021 exceeded the historical maximum (a) and stations where occurred 1-h precipitation more than 10 mm from 2 to 6 and exceeded historical maximum over the same period |
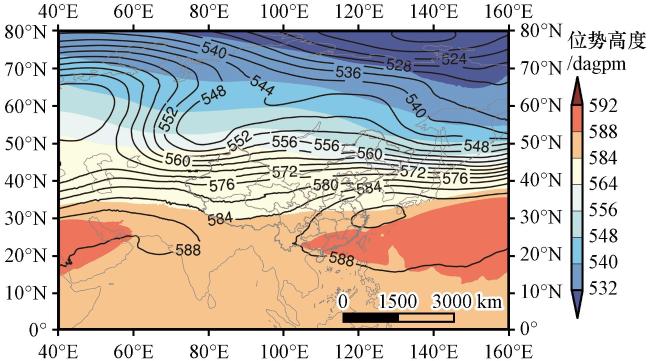
图4 2021年10月2 -6日500 hPa平均位势高度(等值线, 单位: dagpm)和2011 -2020年同期500 hPa平均位势高度(彩色区, 单位: dagpm)对比Fig.4 Comparison between the average geopotential height of 500 hPa from 2 to 6 October 2021 (contours, unit: dagpm) and the average geopotential height during same period from 2011 to 2020 (color area, unit: dagpm) |

图5 2021年10月2日20:00(a)、 3日08:00(b)、 4日08:00(c)、 5日08:00(d)500 hPa位势高度(等值线, 单位: dagpm)和海平面气压(彩色区, 单位: hPa)Fig.5 The geopotential height at 500 hPa (contours, unit: dagpm) and sea level pressure (color area, unit: hPa) at 20:00 on 2 (a), 08:00 on 3 (b), 08:00 on 4 (c), 08:00 on 5 (d) October 2021 |
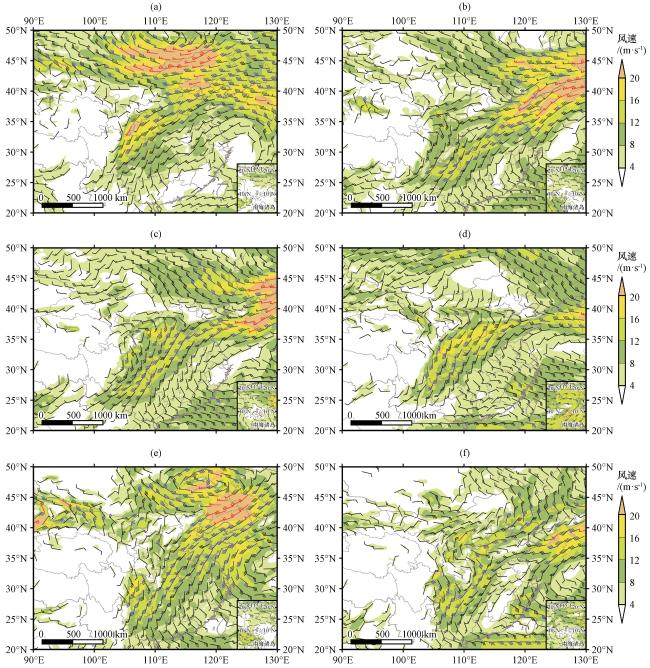
图6 2021年10月2日20:00(a)、 3日20:00(b)、 4日08:00(c)、 5日20:00(d)700 hPa风场(风羽和阴影, 单位: m·s-1)和10月3日02:00(e)、 4日08:00(f)850 hPa风场(风羽和阴影, 单位: m·s-1)Fig.6 The wind field at 700 hPa (wind barbs and shadings, unit: m·s-1) at 20:00 on 2 (a), 20:00 on 3 (b), 08:00 on 4 (c), 20:00 on 5 (d) and the wind field at 850 hPa (wind barbs and shadings, unit: m·s-1) at 02:00 on 3 (e), 08:00 on 4 (f) October 2021 |
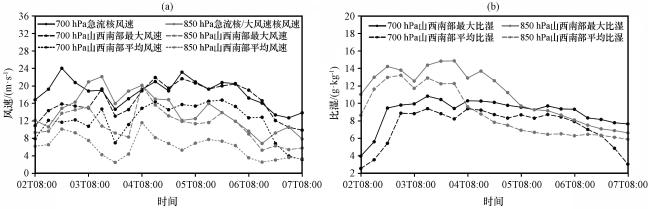
图7 2021年10月2 -6日700 hPa和850 hPa低空急流/西南大风速带中心风速及山西南部风速(单位: m·s-1)时序变化(a)、 山西南部比湿(单位: g·kg-1)时序变化(b)Fig.7 The time series changes of central wind speed of low-level jet/ southwest strong wind belt and the wind speed (unit: m·s-1) in southern Shanxi (a), the time series changes of specific humidity (unit: g·kg-1) in southern Shanxi (b) at 700 hPa and 850 hPa from 2 to 6 October 2021 |
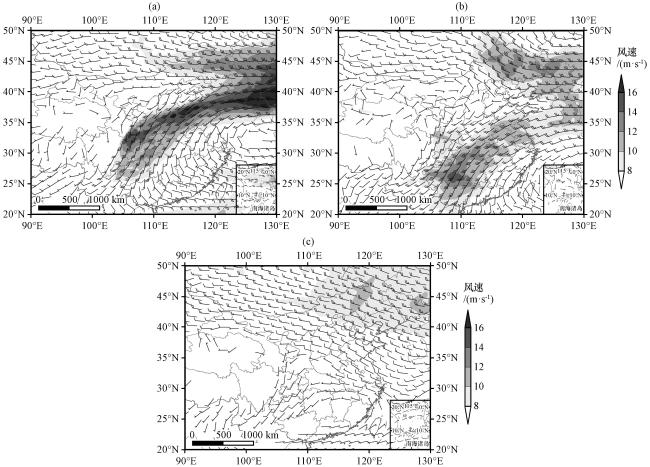
图8 此次极端降水过程(a)与相似环流背景下其他暴雨过程(b)、 常年同期(c)700 hPa平均风场(风羽和阴影, 单位: m·s-1)对比Fig.8 Comparison between the average wind field (wind barbs and shadings, unit: m·s-1) at 700 hPa of this extreme precipitation process (a) and other heavy rainfall process under similar circulation background (b), and the same period on usual years (c) |
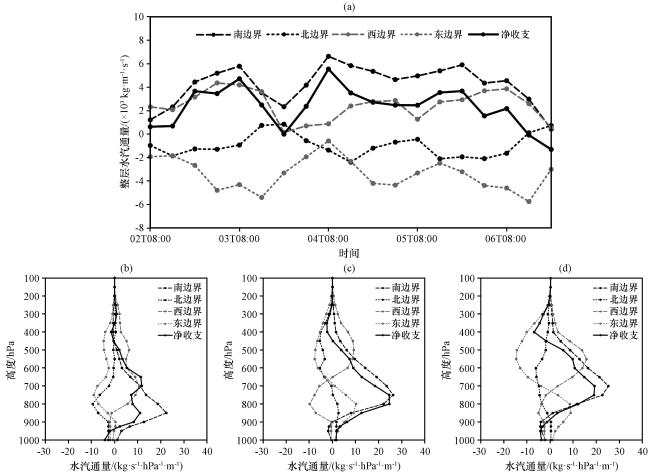
图9 2021年10月2日08:00至6日20:00不同边界整层水汽通量的时间演变(a)、 2日20:00 (b)、 4日08:00 (c)、 5日20:00 (d)不同边界水汽通量的时间-高度剖面Fig.9 The evolution of vertically integrated water vapor flux at different boundaries from 08:00 on 2 to 20:00 on 6 October 2021 (a) and the time-height chart of water vapor flux at different boundaries at 20:00 on 2 (b), 08:00 on 4 (c), 20:00 on 5 (d) October 2021 |
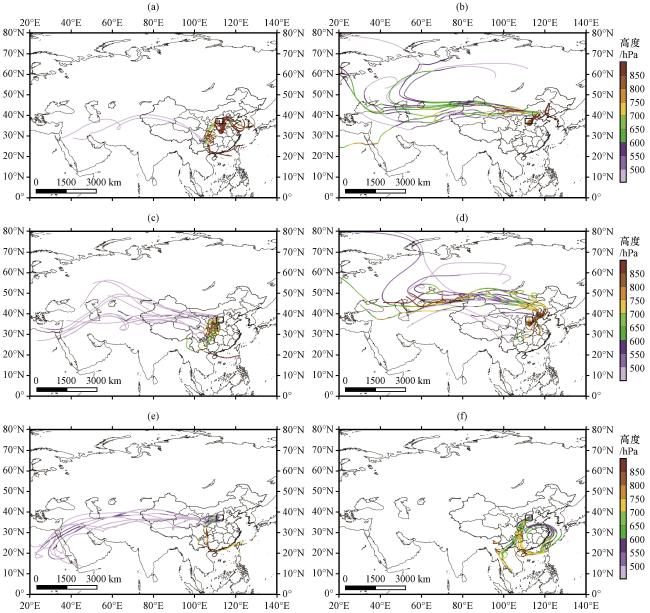
图10 HYSPLIT轨迹模式模拟的2021年10月3日20:00(左)、 5日20:00(右)初始高度为1000 m (a、 b)、 2000 m (c、 d)、 4000 m (e、 f)气团后向追踪240 h的轨迹分布黑色方框表示过程累计降水量大值区; 线条颜色表示轨迹高度(单位: hPa) Fig.10 The horizontal distributions of backward trajectories (backward integrated for 240 h) of air mass by HYSPLIT model at 20:00 on 3 (left) and 20:00 on 5 (right) October 2021 from different initial height respectively at 1000 m (a, b), 2000 m (c, d), 4000 m (e, f).Black box denotes large value area of total accumulated precipitation; color area of lines indicates height (unit: hPa) of trajectories |
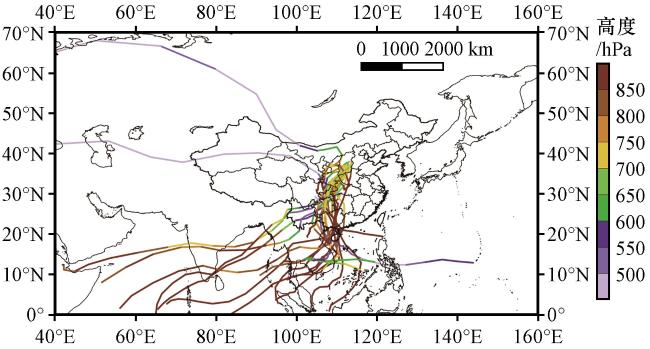
图11 HYSPLIT轨迹模式模拟的2011 -2020年其他暴雨日初始高度为2000 m气团后向追踪240 h的轨迹分布线条颜色为轨迹高度(单位: hPa) Fig.11 The horizontal distributions of backward trajectories (backward integrated for 240 h) of air mass by HYSPLIT model on other heavy rainfall days during 2011 -2020 from initial height at 2000 m.Color lines indicate height (unit: hPa) of trajectories |
|
{{custom_citation.content}}
{{custom_citation.annotation}}
|
|
{{custom_citation.content}}
{{custom_citation.annotation}}
|
|
{{custom_citation.content}}
{{custom_citation.annotation}}
|
|
{{custom_citation.content}}
{{custom_citation.annotation}}
|
|
{{custom_citation.content}}
{{custom_citation.annotation}}
|
|
{{custom_citation.content}}
{{custom_citation.annotation}}
|
|
{{custom_citation.content}}
{{custom_citation.annotation}}
|
|
{{custom_citation.content}}
{{custom_citation.annotation}}
|
|
{{custom_citation.content}}
{{custom_citation.annotation}}
|
|
{{custom_citation.content}}
{{custom_citation.annotation}}
|
|
{{custom_citation.content}}
{{custom_citation.annotation}}
|
|
{{custom_citation.content}}
{{custom_citation.annotation}}
|
|
{{custom_citation.content}}
{{custom_citation.annotation}}
|
|
{{custom_citation.content}}
{{custom_citation.annotation}}
|
|
{{custom_citation.content}}
{{custom_citation.annotation}}
|
|
{{custom_citation.content}}
{{custom_citation.annotation}}
|
|
{{custom_citation.content}}
{{custom_citation.annotation}}
|
|
谌芸, 孙军, 徐珺, 等, 2012.北京721特大暴雨极端性分析及思考(一)观测分析及思考[J].气象, 38(10): 1255-1266.
{{custom_citation.content}}
{{custom_citation.annotation}}
|
|
翟盘茂, 王萃萃, 李威, 2007.极端降水事件变化的观测研究[J].气候变化研究进展, 3(3): 144-148.
{{custom_citation.content}}
{{custom_citation.annotation}}
|
|
杜一博, 李双双, 冯典, 等, 2024.全球变暖背景下陕西省夏季极端降水及其大尺度环流特征[J].高原气象, 43(2): 342-352.DOI: 10.7522/j.issn.1000-0534.2023.00062.Du Y B ,
{{custom_citation.content}}
{{custom_citation.annotation}}
|
|
符娇兰, 马学款, 陈涛, 等, 2017.“16·7”华北极端强降水特征及天气学成因分析[J].气象, 43(5): 528-539.FuJ L, MaX K, ChenT, et al, 2017.Characteristics and synoptic mechanism of the July 2016 extreme precipitation event in north China [J].Meteorological Monthly, 43(5): 528-539.
{{custom_citation.content}}
{{custom_citation.annotation}}
|
|
龚琬丁, 周玉淑, 钟珊珊, 等, 2023.山东地区一次夏季极端暴雨中尺度系统发展演变过程及机理分析[J].大气科学, 47(3): 786-804.
{{custom_citation.content}}
{{custom_citation.annotation}}
|
|
韩洁, 管兆勇, 李明刚, 2012.夏季长江中下游流域性极端日降水事件的环流异常特征及其与非极端事件的比较[J].热带气象学报, 28(3): 367-378.
{{custom_citation.content}}
{{custom_citation.annotation}}
|
|
柯丹, 管兆勇, 2014.华中地区夏季区域性极端日降水事件变化特征及环流异常[J].气象学报, 72(3): 478-493.
{{custom_citation.content}}
{{custom_citation.annotation}}
|
|
李国翠, 钤伟妙, 车少静, 等, 2023.“21·7”特大暴雨系统北上引发太行山中段区域大暴雨成因分析[J].高原气象, 42(5): 1260-1270.DOI: 10.7522/j.issn.1000-0534.2022.00109.Li G C , QianW M, CheS J, et al, 2023.Characteristics and synoptic analysis of a regional heavy rain in middle part of Taihang Mountains caused by "21·7" torrential rain system moving northward [J].Plateau Meteorology, 42(5): 1260-1270.DOI: 10.7522/j.issn.1000-0534.2022.00109 .
{{custom_citation.content}}
{{custom_citation.annotation}}
|
|
卢珊, 胡泽勇, 王百朋, 等, 2020.近56 年中国极端降水事件的时空变化格局[J].高原气象, 39(4): 683-693.DOI: 10.7522/j.issn.1000-0534.2019.00058.Lu S ,
{{custom_citation.content}}
{{custom_citation.annotation}}
|
|
马长健, 李艳, 徐邦琪, 2023.双低空急流对“21·7”河南极端暴雨的影响[J].大气科学, 47(5): 1611-1625.
{{custom_citation.content}}
{{custom_citation.annotation}}
|
|
苗青, 白自斌, 王洪霞, 等, 2021.山西秋季一次极端暴雨过程的异常特征分析[J].干旱气象, 39(6): 984-994.
{{custom_citation.content}}
{{custom_citation.annotation}}
|
|
牛若芸, 刘凑华, 刘为一, 等, 2018.1981-2015年中国95°E以东区域性暴雨过程时、 空分布特征[J].气象学报, 76(2): 182-195.
{{custom_citation.content}}
{{custom_citation.annotation}}
|
|
冉令坤, 李舒文, 周玉淑, 等, 2021.2021 年河南“7·20”极端暴雨动、 热力和水汽特征观测分析[J].大气科学, 45(6): 1366-1383.
{{custom_citation.content}}
{{custom_citation.annotation}}
|
|
沙宏娥, 傅朝, 刘维成, 等, 2022.西北东部半干旱区一次极端特大暴雨的触发和维持机制[J].干旱气象, 40(6): 933-944.
{{custom_citation.content}}
{{custom_citation.annotation}}
|
|
孙继松, 何娜, 王国荣, 等, 2012.“7.21”北京大暴雨系统的结构演变特征及成因初探[J].暴雨灾害, 31(3): 218-225.
{{custom_citation.content}}
{{custom_citation.annotation}}
|
|
孙思远, 管兆勇, 金大超, 2022.江淮地区夏季极端日降水事件变化特征及其与Rossby 波活动的联系[J].大气科学, 46(1): 15-26.
{{custom_citation.content}}
{{custom_citation.annotation}}
|
|
汪小康, 崔春光, 王婧羽, 等, 2022.“21·7”河南特大暴雨水汽和急流特征诊断分析[J].气象, 48(5): 533-544.WangX K, CuiC G, WangJ Y, et al, 2022.Diagnostic analysis on water vapor and jet characteristics of the July 2021 severe torrential rain in Henan Province[J].Meteorological Monthly, 48(5): 533-544.
{{custom_citation.content}}
{{custom_citation.annotation}}
|
|
王洪霞, 苗爱梅, 邱贵强, 等, 2023.“0711”山西晋城极端强降水过程的宏微观特征分析[J].高原气象, 42(5): 1232-1246.DOI: 10.7522/j.issn.1000-0534.2022.00103.Wang H X ,
{{custom_citation.content}}
{{custom_citation.annotation}}
|
|
吴佳, 周波涛, 徐影, 2015.中国平均降水和极端降水对气候变暖的响应: CMIP5 模式模拟评估和预估[J].地球物理学报, 58(9): 3048-3060.
{{custom_citation.content}}
{{custom_citation.annotation}}
|
|
周璇, 孙继松, 张琳娜, 等, 2020.华北地区持续性极端暴雨过程的分类特征[J].气象学报, 78(5): 761-777.
{{custom_citation.content}}
{{custom_citation.annotation}}
|
| {{custom_ref.label}} |
{{custom_citation.content}}
{{custom_citation.annotation}}
|
PDF(14454 KB)
 图1 2021年10月2 -6日总降水量(a)及逐日累计降水量(b~f)(彩色圆点, 单位: mm)图2 2021年10月2 -6日总降水量超过历史同期极值的站点(a)及2 -6日出现1 h降水量达10 mm以上且超过历史同期极值的站点(b)图3 2021年10月2日20:00至7日08:00全省范围内单站最大小时降水量及不同区域代表站点小时降水量时序图图4 2021年10月2 -6日500 hPa平均位势高度(等值线, 单位: dagpm)和2011 -2020年同期500 hPa平均位势高度(彩色区, 单位: dagpm)对比图5 2021年10月2日20:00(a)、 3日08:00(b)、 4日08:00(c)、 5日08:00(d)500 hPa位势高度(等值线, 单位: dagpm)和海平面气压(彩色区, 单位: hPa)图6 2021年10月2日20:00(a)、 3日20:00(b)、 4日08:00(c)、 5日20:00(d)700 hPa风场(风羽和阴影, 单位: m·s-1)和10月3日02:00(e)、 4日08:00(f)850 hPa风场(风羽和阴影, 单位: m·s-1)图7 2021年10月2 -6日700 hPa和850 hPa低空急流/西南大风速带中心风速及山西南部风速(单位: m·s-1)时序变化(a)、 山西南部比湿(单位: g·kg-1)时序变化(b)图8 此次极端降水过程(a)与相似环流背景下其他暴雨过程(b)、 常年同期(c)700 hPa平均风场(风羽和阴影, 单位: m·s-1)对比图9 2021年10月2日08:00至6日20:00不同边界整层水汽通量的时间演变(a)、 2日20:00 (b)、 4日08:00 (c)、 5日20:00 (d)不同边界水汽通量的时间-高度剖面图10 HYSPLIT轨迹模式模拟的2021年10月3日20:00(左)、 5日20:00(右)初始高度为1000 m (a、 b)、 2000 m (c、 d)、 4000 m (e、 f)气团后向追踪240 h的轨迹分布图11 HYSPLIT轨迹模式模拟的2011 -2020年其他暴雨日初始高度为2000 m气团后向追踪240 h的轨迹分布
/
| 〈 |
|
〉 |
