Rainfall-runoff relationship in arid regions is unique and challenging to study. Studies for bridging the hydro-meteorological knowledge gap for planning, designing and managing water resources is therefore vitally important. The objective of this study is to develop a method for estimating unit hydrograph at reasonably finer time resolutions (10-min and 1-h) which can be easily adaptable by practitioners at sub-catchment levels, especially when the focus area is ungauged. Observed wadi-flow at 5-min interval and tipping bucket rainfall measurements at 1-min interval were obtained to cover 10 major watersheds in Oman. The deconvolution method was applied to derive the unit hydrographs (UHs) from wadi-flow and excess rainfall. Key catchment characteristics such as the watershed area, length of the main wadi and the length to the centroid of the catchment area were derived from digital elevation model (DEM) data. The whole study area was then divided into 515 sub-catchments with various shapes and sizes. A strong relationship was found between the wadi length and the length to the centroid of the catchment area (R2>0.89). This relationship was then adopted to simplify the classical Snyder method to determine UHs. Moreover, several parameters of the Snyder method were calibrated to the arid environment by matching the peak-flow, lag-time and three time-widths (75%, 50% and 30% of the peak-flow) of 10-min and 1-h UHs with physical characteristics of the watersheds. All developed relationships were validated with independent rainfall and wadi-flow events. Results indicate that the calibrated parameters in these arid watersheds are quite distinct from those suggested for other regions of the world. A marked difference was found between the 10-min UHs estimated by the S-hydrograph method and the deconvolution method. Therefore, it is concluded that a method depends on natural hydro-meteorological conditions would be more practical in arid region. The proposed methodology can be used for water resources management in arid regions having similar climate and geographical settings.
Luminda N GUNAWARDHANA, Ghazi A AL-RAWAS, Mahad S BAAWAIN. Spatial regression approach to estimate synthetic unit hydrograph by geomorphic characteristics of watersheds in arid regions. Journal of Arid Land, 2020, 12(6): 950-963.
Fig. 1Delineated catchments and locations of rain gauge stations (a) and Thiessen Polygons for Aday catchment (b)
Watershed
Wadi gauge
Area (km2)
Wadi length (km)
Length to the centroid (km)
Aday
FB505467AD
794.2
54.6
25.2
Afi
EL895407AD
313.0
34.2
16.3
Al Khawd
FB104840AD
1660.2
91.9
39.6
Al Uqq
FA160968AD
132.1
22.5
8.2
Arabiyin
GA057335AD
303.8
37.7
18.9
Hayfadh
FA777631AD
122.2
21.7
7.4
Lansab
FA395799AD
44.7
13.3
8.5
Manzariya
FA585595AD
206.4
28.3
9.8
Mayh
FA596055AD
222.0
34.0
15.5
Miglas
FA877343AD
556.8
55.5
25.7
Awabi
EL574613AD
254.4
35.4
14.4
Jannah
FA580672AD
130.8
29.9
18.9
Table 1 List of stations and delineated catchment characteristics
Fig. 2Calibrated and validated relationship between L (the main wadi length from the most upstream point of the watershed to the catchment outlet) and Lc (the distance from the catchment outlet to the point along the main wadi which is the closest to the centroid of the watershed)
Fig. 3Observed and simulated wadi-flow using 1-h UH (unit hydrograph)
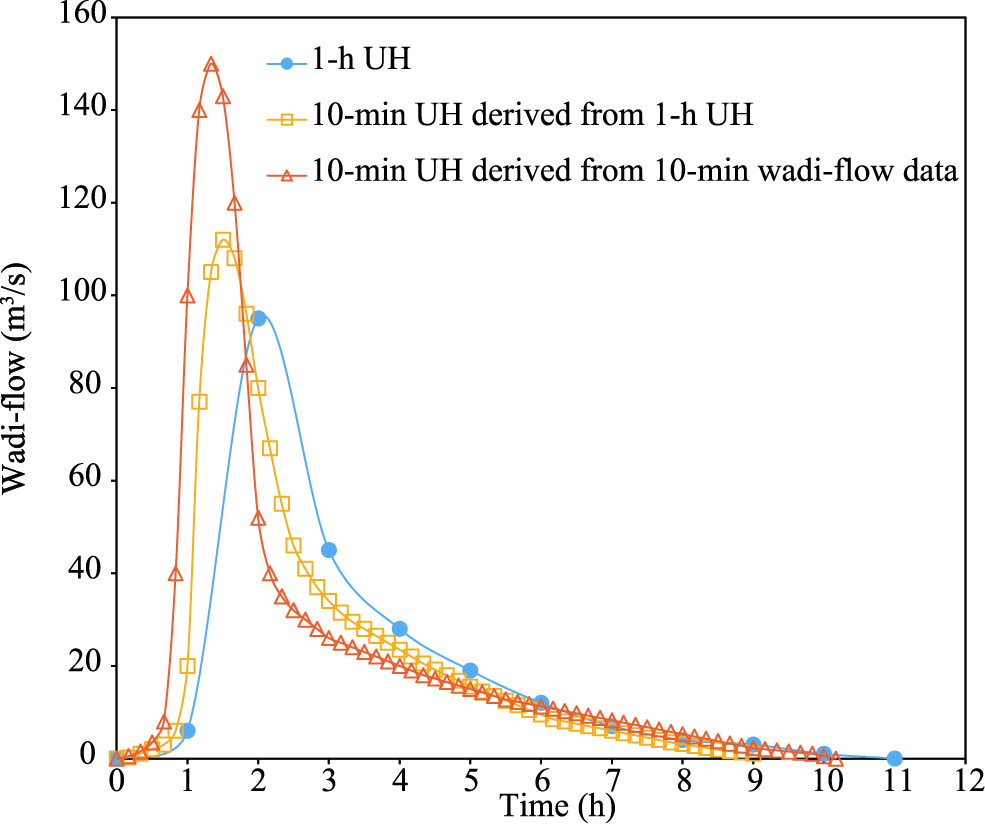
Fig. 4Comparison of 10-min UHs developed by two methods for Aday catchment
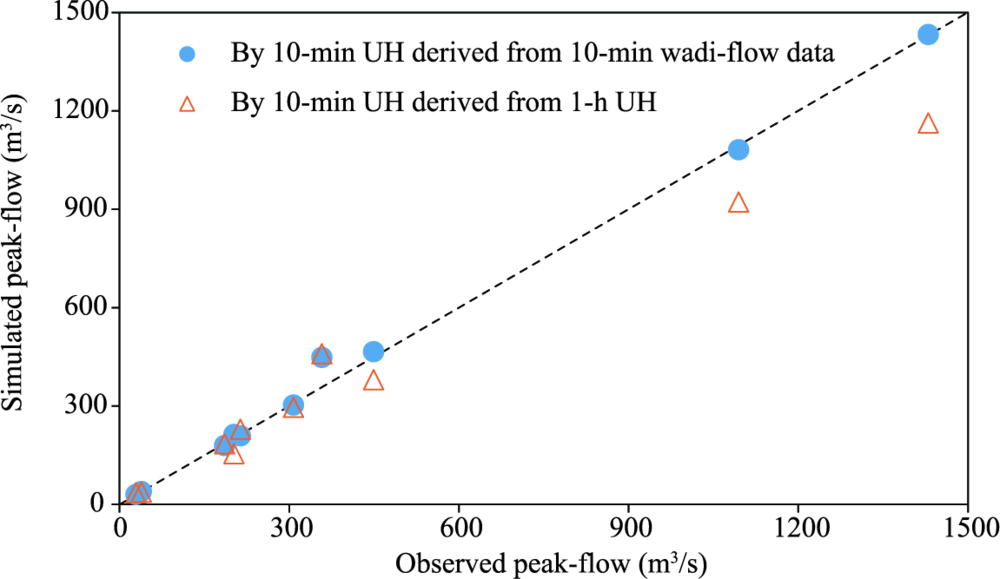
Fig. 5Observed and simulated 10-min averaged peak-flows by two methods for all watersheds
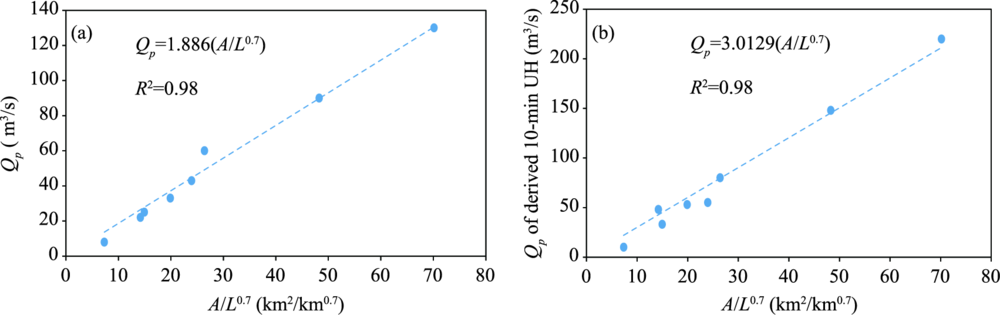
Fig. 6Relationship between peak-flow (Qp)and physical characteristics of the catchment derived using the optimal m value (0.7) for 1-h and 10-min UHs (unit hydrographs)
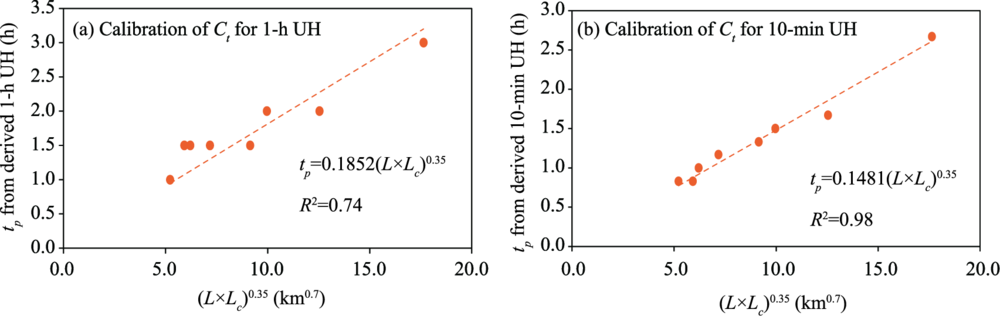
Fig. 7Calibration of Ct (Equation 2) for estimating lag-time for the 1-h and 10-min UHs
Fig. 8Time width at 75% (W75), 50% (W50) and 30% (W30) of the Qp for 1-h and 10-min UHs. A, catchment area.
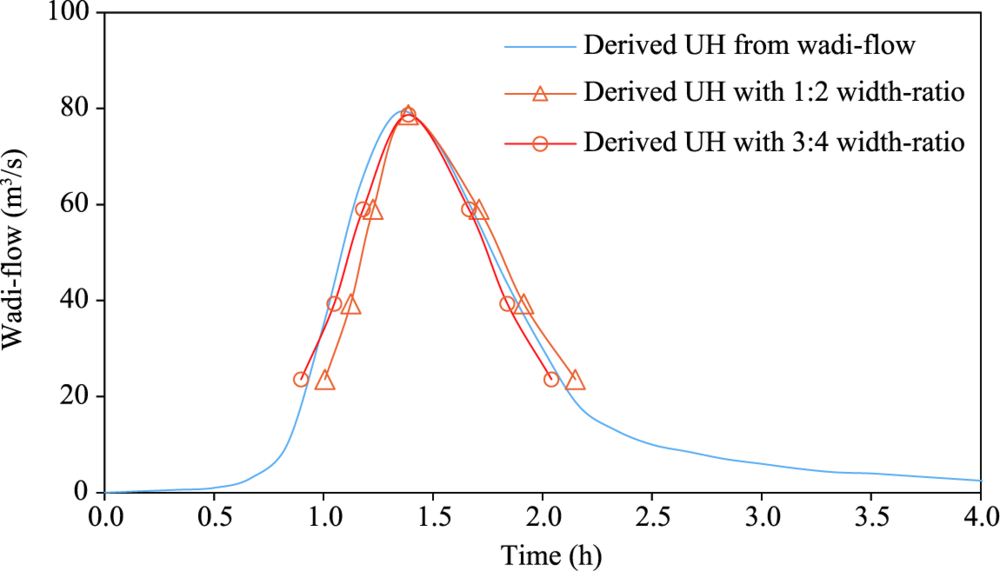
Fig. 9Comparison between developed 10-min UHs for Afi watershed with two different width-ratios
Fig. 10Comparison of observed and simulated wadi-flows from proposed empirical equations
[1]
Abdalla F, Shamy I, El Bamousa A O, et al. 2014. Flash floods and groundwater recharge potentials in arid land alluvial basins, Southern Red Sea Coast, Egypt. International Journal of Geosciences, 5(9):971-982.
[2]
Abdalla O, Al-Rawahi A S. 2013. Groundwater recharge dams in arid areas as tools for aquifer replenishment and mitigating seawater intrusion: example of AlKhod, Oman. Environmental Earth Sciences, 69:1951-1962.
[3]
Ahmadalipour A, Moradkhani H. 2019. A data-driven analysis of flash flood hazard, fatalities, and damages over the CONUS during 1996-2017. Journal of Hydrology, 578:124106.
[4]
Al-Rawas A G, Valeo C. 2010. Relationship between wadi drainage characteristics and peak-flood flows in arid northern Oman. Hydrological Sciences Journal, 55(3):377-393.
[5]
AlSarmi S H, Washington R. 2013. Changes in climate extremes in the Arabian Peninsula: analysis of daily data. International Journal of Climatology, 34(5):1329-1345.
[6]
Angelidis P, Kotsikas M, Kotsovinos N. 2010. Management of upstream dams and flood protection of the Transboundary River Evros/Maritza. Water Resources Management, 24:2467-2484.
[7]
Badrzadeh H, Sarukkalige R, Jayawardena A W. 2015. Hourly runoff forecasting for flood risk management: application of various computational intelligence models. Journal of Hydrology, 529:1633-1643.
[8]
Bhuyan M K, Kumar S, Jena J, et al. 2015. Flood hydrograph with synthetic unit hydrograph routing. Water Resources Management, 29:5765-5782.
[9]
Borga M, Capovilla A, Cazorzi F, et al. 1991. Development and application of a real-time flood forecasting system in the Veneto region of Italy. Water Resources Management, 5:209-216.
[10]
Chow V T, Maidment D R, Mays L W. 1988. Applied Hydrology. New York: McGraw- Hill, 213-230.
[11]
Clark C O. 1943. Storage and the unit hydrograph. Proceedings of the American Society of Civil Engineers, 69(9):1333-1360.
[12]
Dingman S L. 2015. Physical Hydrology (3rd ed.). Illinois: Waveland Press Inc., 455-514.
[13]
El Hassan A A, Sharif H O, Jackson T, et al. 2013. Performance of a conceptual and physically based model in simulating the response of a semi-urbanized watershed in San Antonio, Texas. Hydrological Processes, 27(24):3394-3408.
[14]
Ghoneim E, Foody G M. 2013. Assessing flash flood hazard in an arid mountainous region. Arabian Journal of Geosciences, 6:1191-1202.
[15]
Gray D M. 1961. Synthetic unit hydrographs for small watersheds. Journal of Hydraulics Division, 87(HY4):33-54.
[16]
Greenbaum N, Margalit A, Schick A B, et al. 1998. A high magnitude storm and flood in a hyperarid catchment, Nahal Zin, Negev Desert, Israel. Hydrological Processes, 12(1):1-23.
[17]
Gunawardhana L N, Al-Rawas G A. 2016. A comparison of trends in extreme rainfall using 20-year data in three major cities in oman. The Journal of Engineering Research, 13(2):137-148.
[18]
Gunawardhana L N, Al-Rawas G A, Kwarteng A Y, et al. 2017. Potential changes in the number of wet days and its effect on future intense and annual precipitation in northern Oman. Hydrology Research, 49(1):237-250.
[19]
Hering D, Gerhard M, Manderbach R, et al. 2004. Impact of a 100-year flood on vegetation, benthic invertebrates, riparian fauna and large woody debris standing stock in an alpine floodplain. River Research and Applications, 20(4):445-457.
[20]
Jena S K, Tiwari K N. 2006. Modeling synthetic unit hydrograph parameters with geomorphologic parameters of watersheds. Journal of Hydrology, 319(1-4):1-14.
[21]
Kazama S, Sato A, Kawagoe S. 2009. Evaluating the cost of flood damage based on changes in extreme rainfall in Japan. Sustainability Science, 4:61-69.
[22]
Mayaud C, Gabrovšeka F, Blatnika M, et al. 2019. Understanding flooding in poljes: A modelling perspective. Journal of Hydrology, 575:874-889.
[23]
McCune R H. 1998. Hydrologic analysis and design (2nd ed.). New Jersey: Prentice Hall, 489-493.
[24]
Merz B, Kreibich H, Schwarze R, et al. 2010. Assessment of economic flood damage. Natural Hazards and Earth System Sciences, 10:1697-1724.
[25]
Nouh M. 1990. Flood hydrograph estimation from arid catchment morphology. Hydrological Processes, 4(2):103-120.
[26]
Parsons M. 2018. Extreme floods and river values: A social-ecological perspective. River Research and Applications, 35(10):1677-1687.
[27]
Pilgrim D H, Chapman T G, Doran D G. 1988. Problems of rainfall-runoff modelling in arid and semiarid regions. Hydrological Sciences, 33:379-400.
[28]
Sen Z. 2008. Modified hydrograph method for arid regions. Hydrological Processes, 22(3):356-365.
[29]
Sherman L K. 1932. Streamflow from rainfall by the unit-graph method. Engineering News Record, 108:501-505.
[30]
Snyder F F. 1938. Synthetic unit-hydrographs. Eos Transactions American Geophysical Union, 19(1):447-454.
[31]
USDA-SCS (United States Department of Agriculture-Soil Conservation Service). 1972. National Engineering Handbook, Section 4-Hydrology. Washington D C: USDA-SCS.
[32]
Sudhakar B S, Anupam K S, Akshay O J. 2015. Snyder unit hydrograph and GIS for estimation of flood for un-gauged catchments in Lower Tapi Basin, India. Hydrology Current Research, 6(1):1-10.
[33]
Sugawara M. 1995. Tank model, computer models of watershed hydrology, In: Singh V P. Computer Models of Watershed Hydrology. Colorado: Water Resources Publications, Highlands Ranch, 1130.
[34]
Tomirotti M, Mignosa P. 2017. A methodology to derive synthetic design hydrographs for river flood management. Journal of Hydrology, 555:736-743.
doi: 10.1016/j.jhydrol.2017.10.036
[35]
Usul N, Tezcan B. 1995. Determining synthetic unit hydrographs and parameters for four Turkish basins. Journal of Soil and Water Conservation, 50(2):170-173.
[36]
Young M E, Macumber P G, Watts M, et al. 2004. Electromagnetic detection of deep freshwater lenses in a hyper-arid limestone terrain. Journal of Applied Geophysics, 57(1):43-61.