Coal mining has led to serious ecological damages in arid desert region of Northwest China. However, effects of climatic factor and mining activity on vegetation dynamics and plant diversity in this region remain unknown. Wuhai City located in the arid desert region of Northwest China is an industrial city and dominated by coal mining. Based on Landsat data and field investigation in Wuhai City, we analyzed the vegetation dynamics and the relationships with climate factors, coal mining activity and ecological restoration projects from 2000 to 2019. Results showed that vegetation in Wuhai City mostly consisted of desert plants, such as Caragana microphylla, Tetraena mongolica and Achnatherum splendens. And the vegetation fractional coverage (VFC) and greenness rate of change (GRC) showed that vegetation was slightly improved during the study period. Normalized difference vegetation index (NDVI) was positively correlated with annual mean precipitation, relative humidity and annual mean temperature, indicating that these climate factors might play important roles in the improved vegetation. Vegetation coverage and plant diversity around the coal mining area were reduced by coal mining, while the implementation of ecological restoration projects improved the vegetation coverage and plant diversity. Our results suggested that vegetation in the arid desert region was mainly affected by climate factors, and the implementation of ecological restoration projects could mitigate the impacts of coal mining on vegetation and ecological environment.
ZHOU Siyuan, DUAN Yufeng, ZHANG Yuxiu, GUO Jinjin. Vegetation dynamics of coal mining city in an arid desert region of Northwest China from 2000 to 2019. Journal of Arid Land, 2021, 13(5): 534-547.
Fig. 1Location of study area and distribution of sampling site in Wuhai City (a, b and c). Area M (d) is near to open-pit coal mine. Area M includes the core reserve area (M1), reserve area (M2) and marginal area (M3) of T. mongolica and open-pit coal mine (CM). BG, botanical garden; DR, dump waste reclamation area; TmD, T. mongolica disturbance area; W, wetland; CR, abandoned coking vegetation restoration area; SR, subsidence restoration area; NS, natural shrub vegetation area; TmN, T. mongolica Nature Reserve; GM, Gander Mountain.
Remote sensing type
Date (mm/dd/yy)
Remote sensing type
Date (mm/dd/yy)
Landsat TM
08/29/2000
Landsat TM
06/18/2011
Landsat TM
08/19/2002
Landsat OLI
07/28/2014
Landsat TM
08/15/2003
Landsat OLI
05/30/2016
Landsat TM
06/01/2005
Landsat OLI
05/17/2017
Landsat TM
08/14/2006
Landsat OLI
08/29/2018
Landsat TM
08/10/2007
Landsat OLI
06/19/2019
Landsat TM
06/28/2009
Table 1 Remote sensing images used in this study
Level
Value of VFC
Description
Low coverage
0.00-0.05
Moderate desertification land, rock, buildings, opencast mine, waste dump and low yield grassland
Medium-low coverage
0.05-0.15
Medium-low yield grassland, industrial land and sporadic vegetation
Medium coverage
0.15-0.30
Unutilized land, medium-low yield grassland and medium-low shrubland
Medium-high coverage
0.30-0.60
Medium-high yield grassland, medium-high shrubland and sparse woodland
High coverage
0.60-1.00
High-yield grassland, dense shrubland, reclaimed dump, cropland and dense woodland
Table 2 Classification of vegetation fractional coverage (VFC) in Wuhai City from 2000 to 2019
Fig. 2Spatiotemporal distribution of vegetation fractional coverage (VFC) in Wuhai City. (a), 2000; (b), 2006; (c), 2009; (d), 2011; (e), 2019.
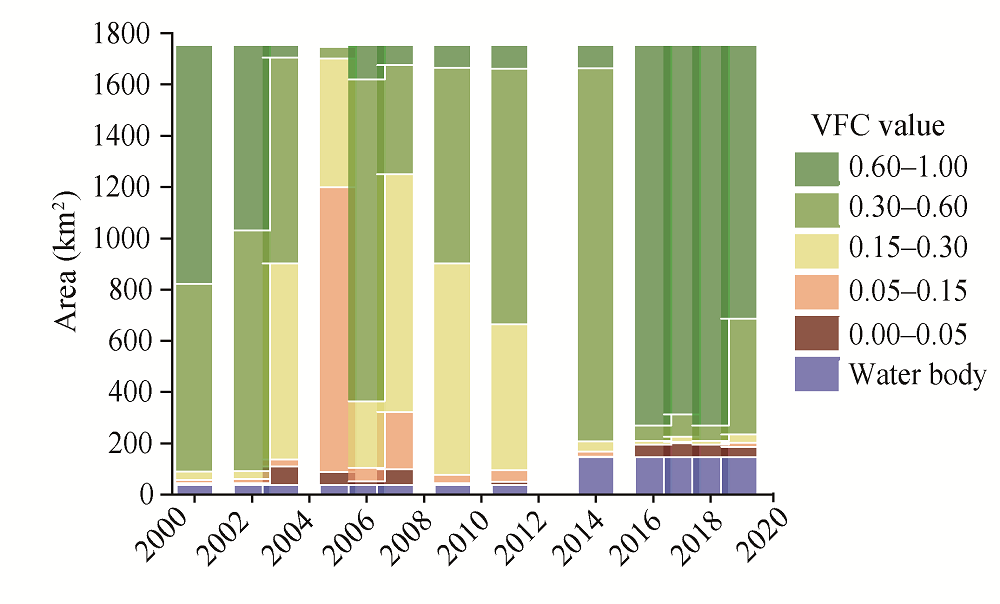
Fig. 3Area changes in vegetation fractional coverage (VFC) in Wuhai City from 2000 to 2019
Value of GRC
Category
2000-2009
2009-2019
2000-2019
Area (km2)
Percentage of total area (%)
Area (km2)
Percentage of total area (%)
Area (km2)
Percentage of total area (%)
< -0.10
Severe degradation
57.82
3.30
66.09
3.77
6.84
0.39
-0.10- -0.05
Moderate degradation
960.02
54.73
24.08
1.37
22.56
1.29
-0.05-0.00
Slight degradation
631.30
35.99
26.01
1.48
102.29
5.83
0.00-0.05
Slight improvement
49.26
2.81
121.68
6.94
1572.91
89.68
0.05-0.10
Moderate improvement
17.97
1.02
1457.92
83.10
46.33
2.64
>0.10
Significant improvement
35.86
2.04
58.23
3.32
0.18
0.01
Table 3 Dynamics of greenness rate of change (GRC) during three stages in Wuhai City
Fig. 4Dynamics of annual land cover classification in Wuhai City. (a), 2000; (b), 2006; (c), 2009; (d), 2011; (e), 2019.
Fig. 5Area of land cover and coal output in Wuhai City from 2000 to 2019
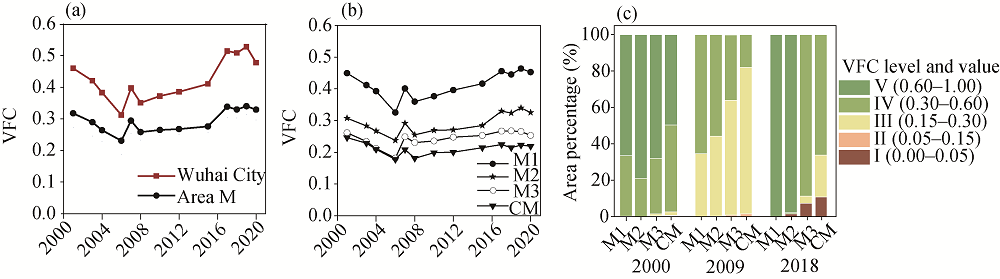
Fig. 6Change in vegetation fractional coverage (VFC) over a chronological sequence in Wuhai City (a) and area M (b) and area percentage of different VFC levels in M1 (core reserve area), M2 (reserve area), M3 (marginal area) and CM (open-pit coal mine) in 2000, 2009 and 2018 (c)
Fig. 7Normalized difference vegetation index (NDVI) change at sampling sites in Wuhai City from 2000 to 2019. BG, botanical garden; CR, abandoned coking plant restoration area; SR, subsidence restoration area; DR, dump waste reclamation area; TmD, T. mongolica disturbance area; NS, natural shrub vegetation area; GM, Gander Mountain; TmN, T. mongolica Nature Reserve; W, wetland.
Sampling site
Species number
Dominant species
BG
15
Elaeagnus angustifolia; Populus alba var. pyramidalis; Platycladus orientalis
SR1
14
Populus alba var. pyramidalis; Amorpha fruticose; Cynanchum chinense
SR2
15
Pinus sylvestris var. mongolica; Picea asperata; Ulmus pumila
Table 4 Plant community composition in each sampling site
Fig. 8Plant alpha diversity indices, coverage, occurrence of T. mongolica (a) and beta diversity indices (b) at sampling sites in Wuhai City from 2000 to 2019. BG, botanical garden; CR, abandoned coking plant restoration area; SR, subsidence restoration area; DR, dump waste reclamation area; TmD, T. mongolica disturbance area; NS, natural shrub vegetation area; GM, Gander Mountain; TmN, T. mongolica Nature Reserve; W, wetland.
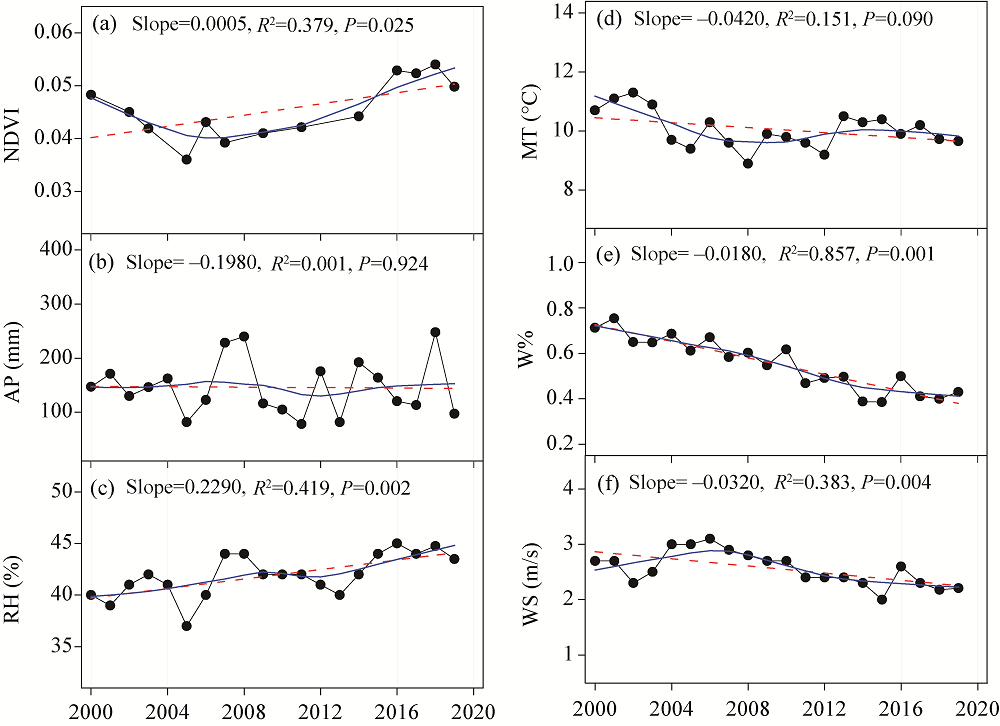
Fig. 9Inter-annual normalized difference vegetation index (NDVI, a), annual precipitation (AP, b), relative humidity (RH, c), mean temperature (MT, d), strong wind frequency (W%, e) and annual average wind speed (WS, f) in Wuhai City from 2000 to 2019. The linear trend (red dashed lines) is based on ordinary least squares regression, while the nonlinear trend (blue solid lines) is fitted by LOWESS (locally weighted scatter point smoothing).
[1]
Abdourhamane T A, Tidjani A D, Rajot J L, et al. 2019. Dynamics of wind erosion and impact of vegetation cover and land use in the Sahel: A case study on sandy dunes in southeastern Niger. CATENA, 177:272-285.
doi: 10.1016/j.catena.2019.02.011
[2]
Basarin B, Lukić T, Pavić D, et al. 2016. Trends and multi-annual variability of water temperatures in the river Danube, Serbia. Hydrological Processes, 30(18):3315-3329.
doi: 10.1002/hyp.v30.18
[3]
Brown J, Howard D, Wylie B, et al. 2015. Application-ready expedited MODIS data for operational land surface monitoring of vegetation condition. Remote Sensing, 7(12):16226-16240.
doi: 10.3390/rs71215825
[4]
Cao M, Woodward F I. 1998. Dynamic responses of terrestrial ecosystem carbon cycling to global climate change. Nature, 393(6682):249-252.
doi: 10.1038/30460
[5]
Chen C, Park T, Wang X, et al. 2019. China and India lead in greening of the world through land-use management. Nature Sustainability, 2:122-129.
doi: 10.1038/s41893-019-0220-7
pmid: 30778399
[6]
Chu H S, Venevsky S, Wu C, et al. 2019. NDVI-based vegetation dynamics and its response to climate changes at Amur-Heilongjiang River Basin from 1982 to 2015. Science of the Total Environment, 650:2051-2062.
doi: 10.1016/j.scitotenv.2018.09.115
[7]
Dardel C, Kergoat L, Hiernaux P, et al. 2014. Re-greening Sahel: 30 years of remote sensing data and field observations (Mali, Niger). Remote Sensing of Environment, 140:350-364.
doi: 10.1016/j.rse.2013.09.011
[8]
Dong G G, Zhong K B, Tie L S, et al. 2011. Impacts of coal mining on the aboveground vegetation and soil quality: a case study of Qinxin coal mine in Shanxi Province, China. Clean-Soil, Air, Water, 39(3):219-225.
doi: 10.1002/clen.v39.3
[9]
Duan H, Yan C, Tsunekawa A, et al. 2011. Assessing vegetation dynamics in the Three-North Shelter Forest region of China using AVHRR NDVI data. Environmental Earth Sciences, 64(4):1011-1020.
doi: 10.1007/s12665-011-0919-x
[10]
Feng Y, Wang J M, Bai Z K, et al. 2019. Effects of surface coal mining and land reclamation on soil properties: A review. Earth-Science Reviews, 191:12-25.
doi: 10.1016/j.earscirev.2019.02.015
[11]
Gebrehiwot K, Demissew S, Woldu Z, et al. 2019. Elevational changes in vascular plants richness, diversity, and distribution pattern in Abune Yosef mountain range, Northern Ethiopia. Plant Diversity, 41(4):220-228.
doi: 10.1016/j.pld.2019.06.005
pmid: 31528781
[12]
González-Hernández M P, Mouronte V, Romero R, et al. 2020. Plant diversity and botanical composition in an Atlantic heather-gorse dominated understory after horse grazing suspension: Comparison of a continuous and rotational management. Global Ecology and Conservation, 23:e01134.
doi: 10.1016/j.gecco.2020.e01134
[13]
Hicke J A, Asner G P, Randerson J T, et al. 2002. Trends in North American net primary productivity derived from satellite observations, 1982-1998. Global Biogeochemical Cycles, 16(2):1018.
[14]
Huang F, Xu S L. 2016. Spatio-temporal variations of rain-use efficiency in the west of Songliao Plain, China. Sustainability, 8(4):308.
doi: 10.3390/su8040308
[15]
Karan S K, Samadder S R, Maiti S K. 2016. Assessment of the capability of remote sensing and GIS techniques for monitoring reclamation success in coal mine degraded lands. Journal of Environmental Management, 182:272-283.
doi: 10.1016/j.jenvman.2016.07.070
[16]
Li S J, Sun Z G, Tan M H, et al. 2016. Effects of rural-urban migration on vegetation greenness in fragile areas: A case study of Inner Mongolia in China. Journal of Geographical Sciences, 26:313-324.
doi: 10.1007/s11442-016-1270-7
[17]
Lin Y, Xin X P, Zhang H B, et al. 2015. The implications of serial correlation and time-lag effects for the impact study of climate change on vegetation dynamics-a case study with Hulunber meadow steppe, Inner Mongolia. International Journal of Remote Sensing, 36(19-20):5031-5044.
doi: 10.1080/01431161.2015.1093196
[18]
Liu S L, Li W P, Qiao W, et al. 2019. Effect of natural conditions and mining activities on vegetation variations in arid and semiarid mining regions. Ecological Indicators, 103:331-345.
doi: 10.1016/j.ecolind.2019.04.034
[19]
Liu Z J, Wang J Y, Wang X Y, et al. 2020. Understanding the impacts of 'Grain for Green' land management practice on land greening dynamics over the Loess Plateau of China. Land Use Policy, 99:105084.
doi: 10.1016/j.landusepol.2020.105084
[20]
Mantero P, Moser G, Serpico S B. 2005. Partially supervised classification of remote sensing images through SVM-based probability density estimation. IEEE Transactions on Geoscience and Remote Sensing, 43(3):559-570.
doi: 10.1109/TGRS.2004.842022
[21]
Pettorelli N, Vik J, Mysterud A, et al. 2005. Using the satellite-derived NDVI to assess ecological responses to environmental change. Trends in Ecology & Evolution, 20(9):503-510.
doi: 10.1016/j.tree.2005.05.011
[22]
Piao S L, Fang J Y. 2001. Dynamic vegetation cover change over the last 18 years in China. Quaternary sciences, 21(4):294-302.
[23]
Ruan M Y, Zhang Y X, Chai T Y. 2020. Rhizosphere soil microbial properties on Tetraena mongolica in the arid and semi-arid regions, China. International Journal of Environmental Research and Public Health, 17(14):5142.
doi: 10.3390/ijerph17145142
[24]
Sellers P, Meeson B, Hall F, et al. 1995. Remote sensing of the land surface for studies of global change: Models-algorithms-experiments. Remote Sensing of Environment, 51(1):3-26.
doi: 10.1016/0034-4257(94)00061-Q
[25]
Shi Y, Jin N, Ma X L, et al. 2020. Attribution of climate and human activities to vegetation change in China using machine learning techniques. Agricultural and Forest Meteorology, 294:108146.
doi: 10.1016/j.agrformet.2020.108146
[26]
Tian H J, Cao C X, Chen W, et al. 2015. Response of vegetation activity dynamic to climatic change and ecological restoration programs in Inner Mongolia from 2000 to 2012. Ecological Engineering, 82:276-289.
doi: 10.1016/j.ecoleng.2015.04.098
[27]
Tong S Q, Zhang J Q, Ha S, et al. 2016. Dynamics of fractional vegetation coverage and its relationship with climate and human activities in Inner Mongolia, China. Remote Sensing, 8(9):776.
doi: 10.3390/rs8090776
[28]
Wang S F, Cao Y G, Pietrzykowski M, et al. 2020 Spatial distribution of soil bulk density and its relationship with slope and vegetation allocation model in rehabilitation of dumping site in loess open-pit mine area. Environmental Monitoring and Assessment, 192:740.
doi: 10.1007/s10661-020-08692-6
[29]
Wang W F, Hao W D, Bian Z F, et al. 2014. Effect of coal mining activities on the environment of Tetraena mongolica in Wuhai, Inner Mongolia, China-A geochemical perspective. International Journal of Coal Geology, 132:94-102.
doi: 10.1016/j.coal.2014.08.006
[30]
Wu G L, Du G Z, Liu Z H, et al. 2009. Effect of fencing and grazing on a Kobresia-dominated meadow in the Qinghai-Tibetan Plateau. Plant and Soil, 319(1):115-126.
doi: 10.1007/s11104-008-9854-3
[31]
Xu Z W, Hu R, Wang K X, et al. 2018. Recent greening (1981-2013) in the Mu Us dune field, northcentral China, and its potential causes. Land Degradation & Development, 29(5):1509-1520.
doi: 10.1002/ldr.v29.5
[32]
Zhang D J, Jia Q Q, Xu X, et al. 2018. Contribution of ecological policies to vegetation restoration: A case study from Wuqi County in Shaanxi Province, China. Land Use Policy, 73:400-411.
doi: 10.1016/j.landusepol.2018.02.020
[33]
Zhang X Z, Dai J H, Ge Q S. 2013. Variation in vegetation greenness in spring across eastern China during 1982-2006. Journal of Geographical Sciences, 23:45-46.
doi: 10.1007/s11442-013-0992-z
[34]
Zhen J H. 2012. Change of landscape pattern and its impact in the distribution region of Tetraena mongolica Maxim. Applied Mechanics and Materials, 229-231:2694-2697.
doi: 10.4028/www.scientific.net/AMM.229-231
[35]
Zhu J, Wang X, Zhang L X, et al. 2015. System dynamics modeling of the influence of the TN/TP concentrations in socioeconomic water on NDVI in shallow lakes. Ecological Engineering, 76(5210):27-35.
doi: 10.1016/j.ecoleng.2014.06.030